Primary maths: Statistics

Explore this collection of lesson ideas, activities and fun games to introduce and develop KS1 and KS2 pupils' knowledge of statistics

Tes Resources Team

Colourful Bar Chart Representing KS1 & KS2 Statistics Lessons In Primary Maths

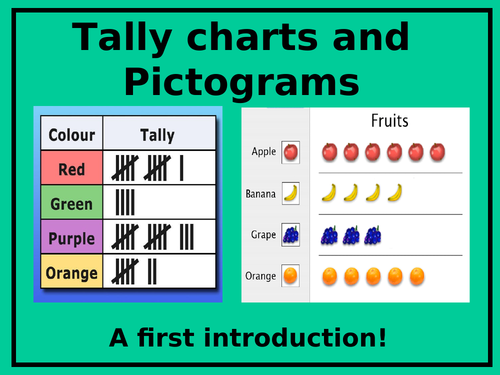
Discover top ways to get to grips with graphs, charts and tables with primary learners

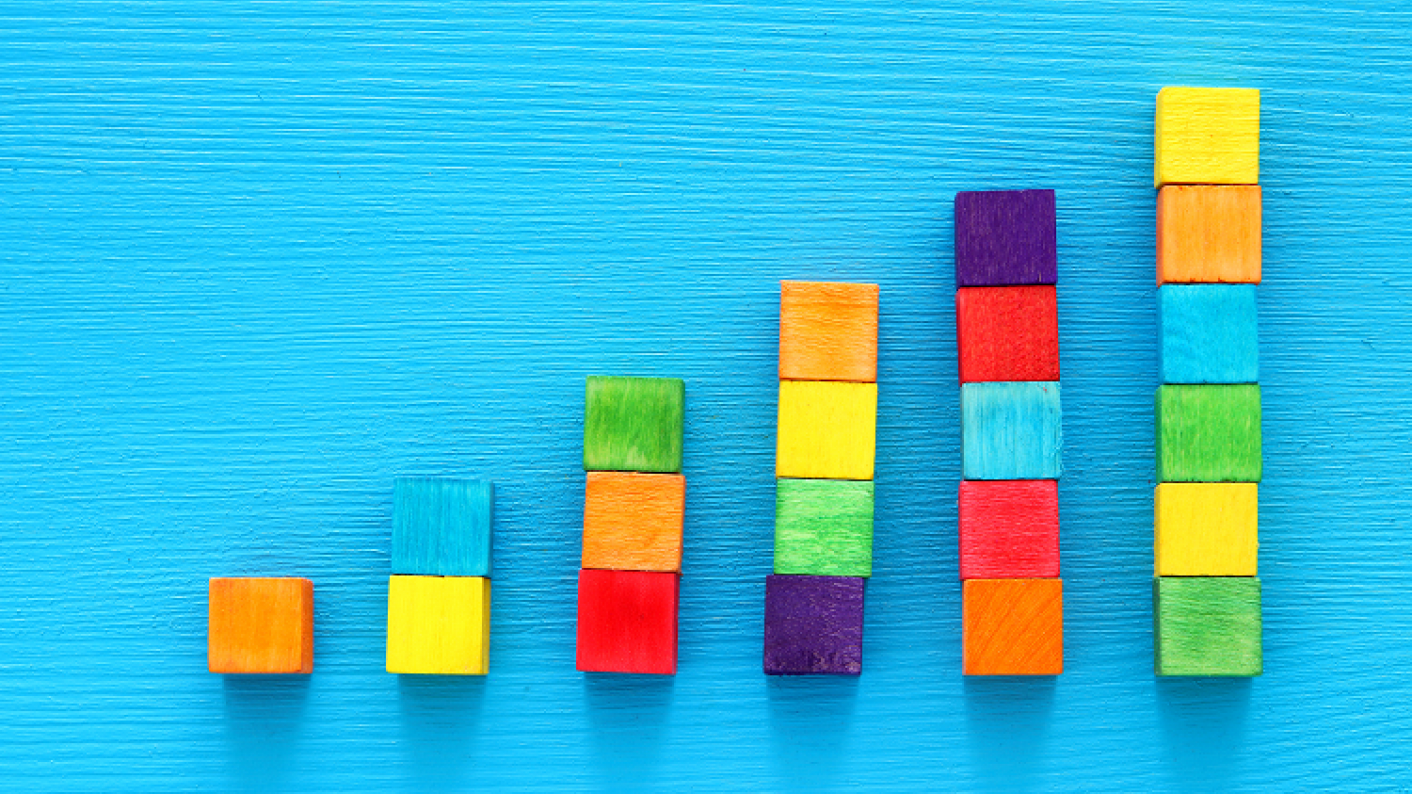
With multiple opportunities to gather data relevant to your pupils' lives and apply it to real-life situations, statistics can be one of the most practical topics for you to explore with your class. From bar graphs and tally charts to pie charts and pictograms, we've selected a handful of interesting ways to tackle the topic.

Lesson resources

Kick-start a unit on statistics with help from these introductory lesson presentations, covering a range of the main concepts, engaging lesson ideas and structured units of work.

Bar Charts - Year 3
Online_Teaching_Resources

Bar Charts - Year 3

(1)
Bar Charts - Year 3: KS2 Maths Teaching Resource This KS2 mathematics teaching resource is an aid to delivering a lesson on Bar Charts, covering the curriculum objective of the year 3 maths programme of study (Statistics). Content includes: * What are bar charts introduction * Using the r...
Introduction to interpreting and handling data - column bar graphs
Tigerlearn

Introduction to interpreting and handling data - column bar graphs

(1)
A simple PPT lesson which will introduce interpreting and handling data, specifically with relation to column charts/ bar graphs. It begins by asking students to guess what a blank graph could represent (interpreting data), before moving on to various graphs with questions designed to introduce the...
1. Statistics: pictograms lesson pack (Y3)
MrsSBunny

1. Statistics: pictograms lesson pack (Y3)

(1)
This ready-to-use, top quality set of resources allows teachers to easily teach the Year 3 Maths topic of pictograms to a mixed ability class. This lesson links well with White Rose Maths Statistics. It forms part of a series of lessons on money which include coverage of the objectives: Inte...

Activities and games

Delving into the world of data handling doesn't have to be complicated or dull! Why not try some of these varied activities for converting numbers into clear, visual representations or recap the key elements of statistics while having fun with these games and challenges?

BAR GRAPHS AND PICTOGRAPHS: ACTIVITY SHEETS
Laurane Rae

BAR GRAPHS AND PICTOGRAPHS: ACTIVITY SHEETS

(1)
This graphing unit features interpreting data in bar graphs and pictographs. Data is collected using concrete materials such as visuals, dice, spinners, coins and M&M s . This data is then represented in bar graphs and interpreted. The section on pictographs requires collected data to be inter...
Firework Bar Graphs | UK Version
LittleStreams

Firework Bar Graphs | UK Version

(4)
This activity offers a different way to teach tally and bar graphs. Students choose 20 firework cards from the firework deck (or any amount you choose from the 45 cards). We find that 20 cards offers the most interesting collection to work with. Students are invited to collect the data of their...
Tally Charts Powerpoint Game by Arithmetickx
reksum

Tally Charts Powerpoint Game by Arithmetickx

(0)
A fun, interactive PPT game designed to help improve children's understanding of tally charts. This game is suitable for Year 3 and beyond. It would also be ideal for any Year 2 children working at greater depth. All Arithmetickx games incorporate 10 questions which increase in difficulty as the gam...
Quiz, Quiz Trade  activity cards - Interpreting pictograms
busyprimaryteacher247

Quiz, Quiz Trade activity cards - Interpreting pictograms

(0)
This is a great co-operative learning game for consolidating new learning in a fun and active way. Also great for revision. My classes enjoy the excuse to move around, work with different partners (and their friends) and have fun while learning. It does take some practice for them to get the hang ...
Complete the Graph - Eight Pages!
Teaching Ideas

Complete the Graph - Eight Pages!

(0)
Can your children use the data provided to create pictograms, bar charts, line graphs and pie charts? Eight different pages are included: \* Animals in a zoo (Pictogram) \* Favourite sports (Pictogram) \* Traffic survey (Bar chart) \* Favourite teams (Bar chart) \* Car wash (Line graph)...
Bar Chart Worksheets (x20)
krisgreg30

Bar Chart Worksheets (x20)

(0)
Twenty worksheets that focus on being able to work with bar charts in different ways. Included are ten worksheets that require children to practise drawing charts when given a set of data. These include different examples of data and different scales, with some data matching the scale and some requ...
Interpret pictograms 2s, 5s, and 10s
jennywren83

Interpret pictograms 2s, 5s, and 10s

(0)
Resources to support interpret pictograms 2s, 5s, and 10s from the small steps unit, Spring Block 2, year 2. The resources follow the planing from White Rose Maths. Included in the package are varied fluency, reasoning and problem solving questions. Documents are in word and pdf for ease of use.