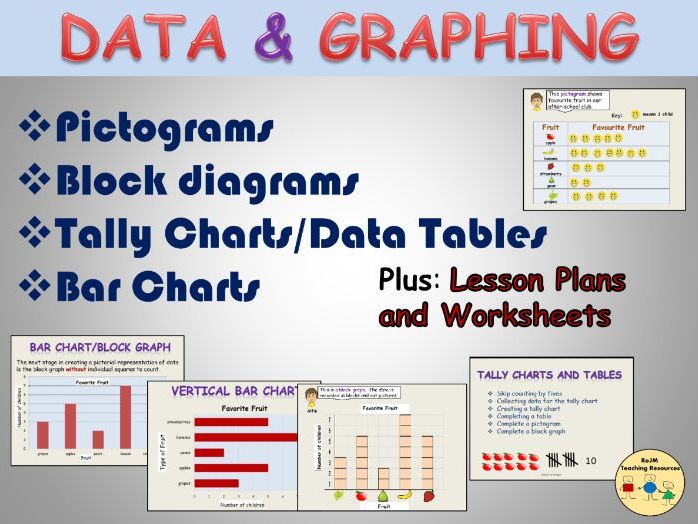


This product contains data and graphing relating to pictograms, bar charts, block graphs and tally charts and tables. It also includes lesson plans, PowerPoint presentations and worksheet activities. Suitable for Grades 1 to 3.
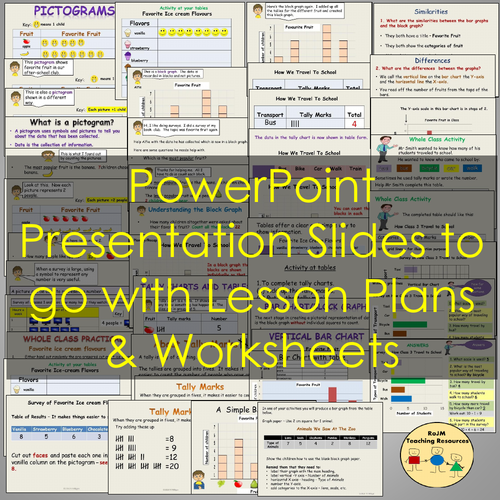
There is a PowerPoint Presentation on each lesson.
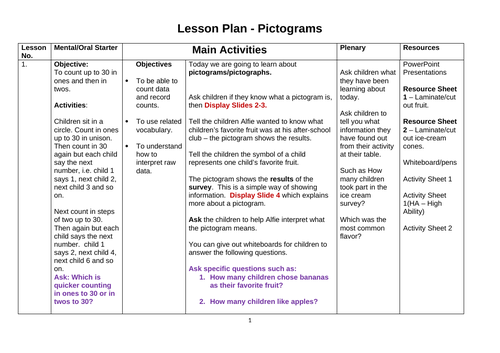
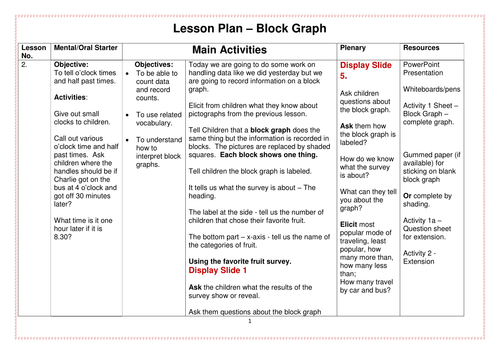
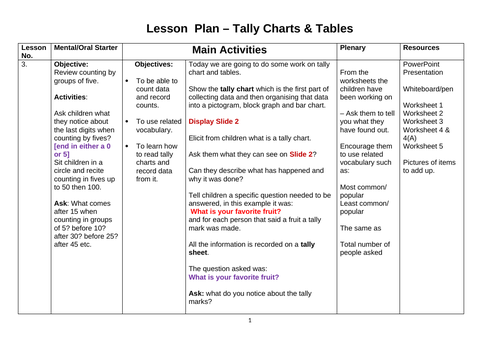
Lesson Plans contain:-
-Oral/Mental Starters
-Main activities
-Plenaries (Recap session)
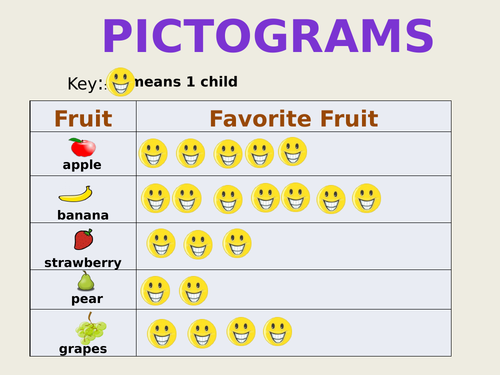
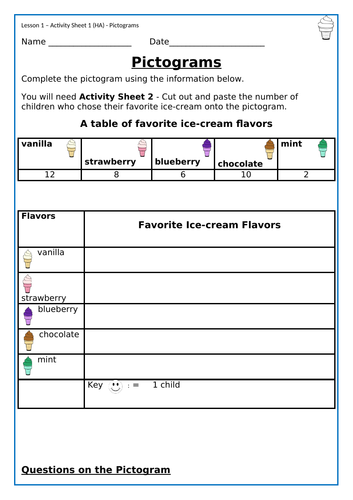
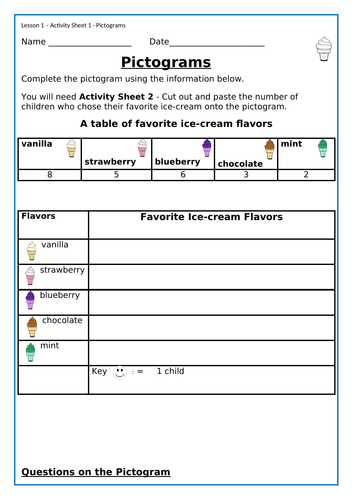
Lesson Plan 1: Pictograms - 2 differentiated worksheet activities and question sheet on pictograms.
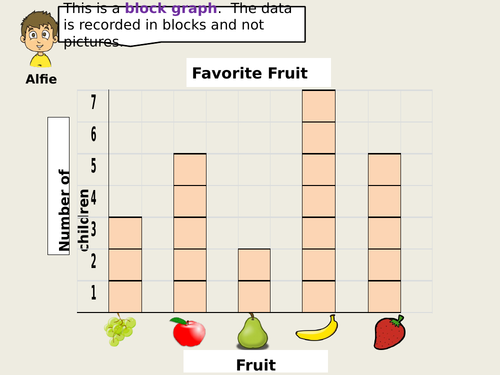
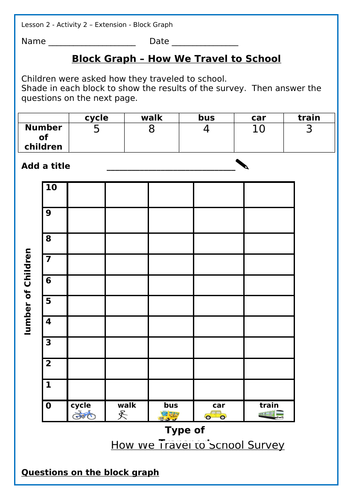
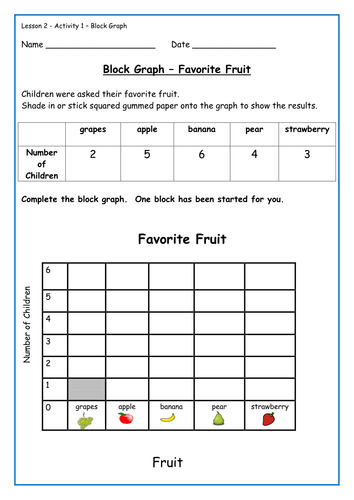
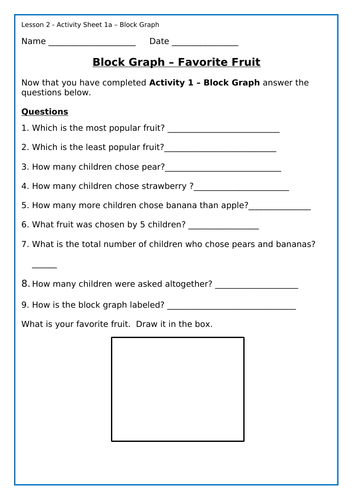
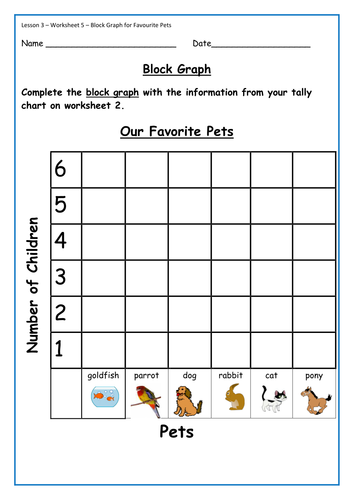
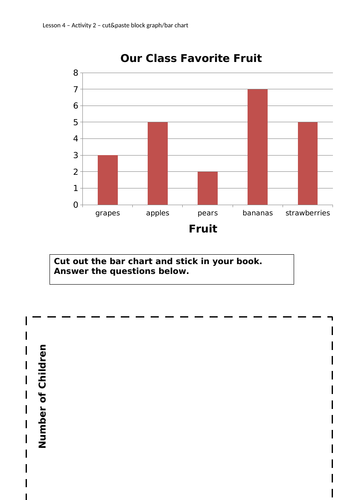
Lesson Plan 2: Block Graphs - worksheet activities on creating block graphs and question sheets.
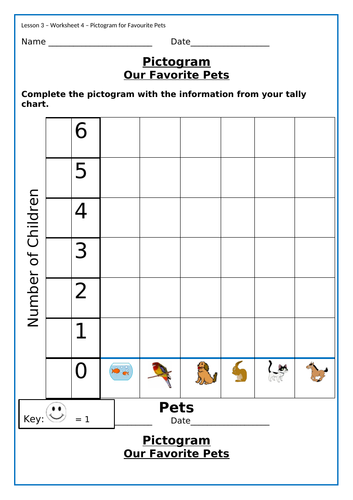
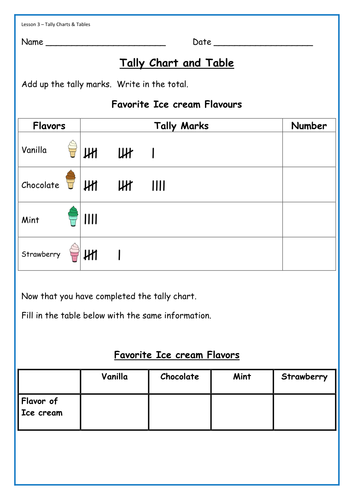
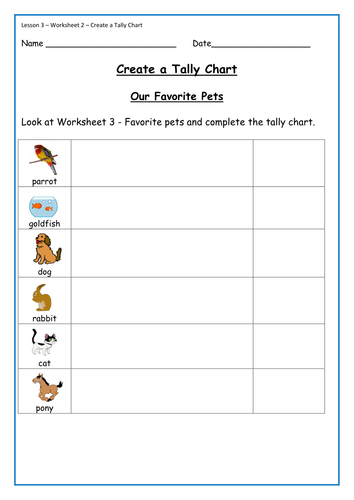
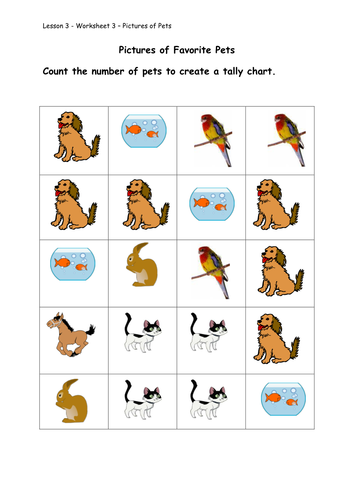
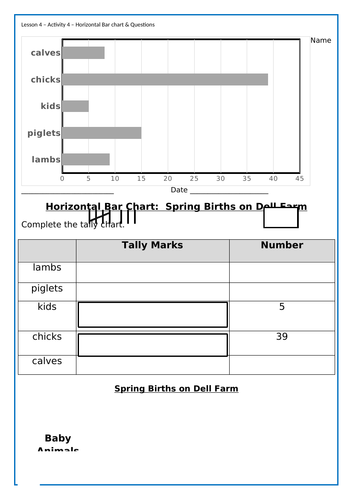
Lesson Plan 3: Tally Charts and Tables - Students learn how to tally and read tables in order to create a pictogram and block graph. - 4 differentiated worksheet activities in this lesson.
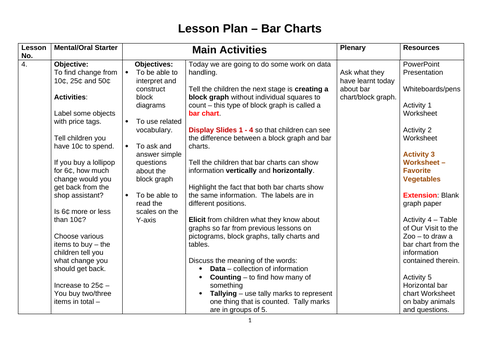
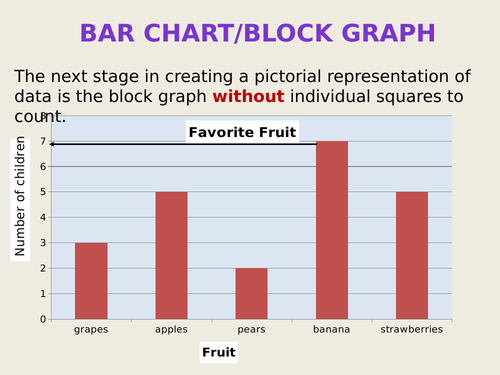
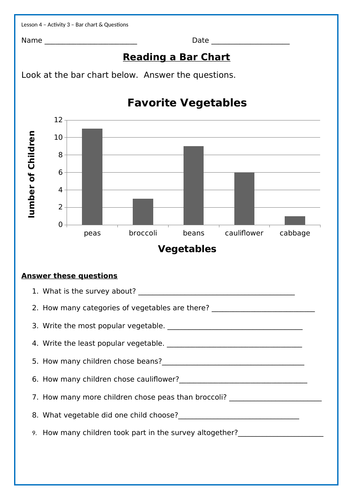
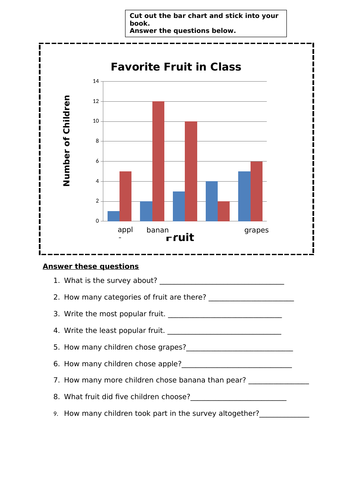
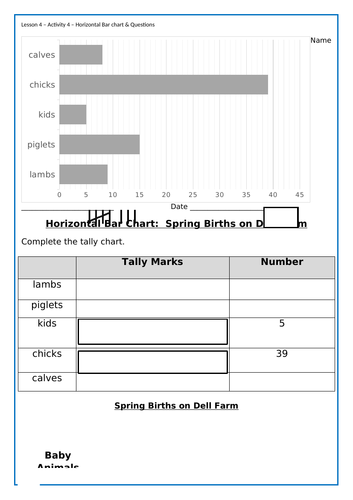
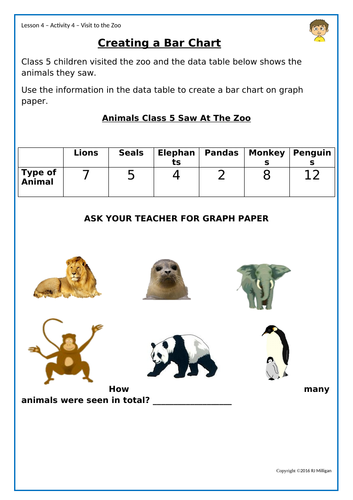
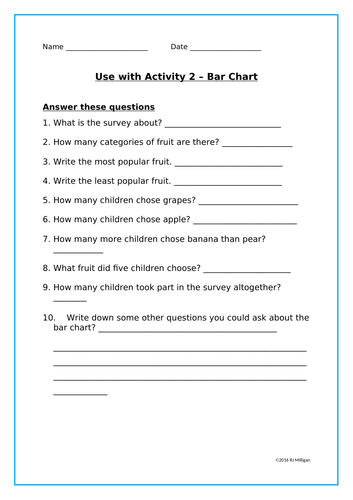
Lesson Plan 4: Bar Charts (vertical and horizonal) - Students read and answer questions on bar charts and learn to interpret them; produce a bar chart from a table - Zoo Animals.
Surveys on Favorite Fruit, Flavors of Ice cream, Favorite Pets , How Children Travel to School and Favorite Vegetables.
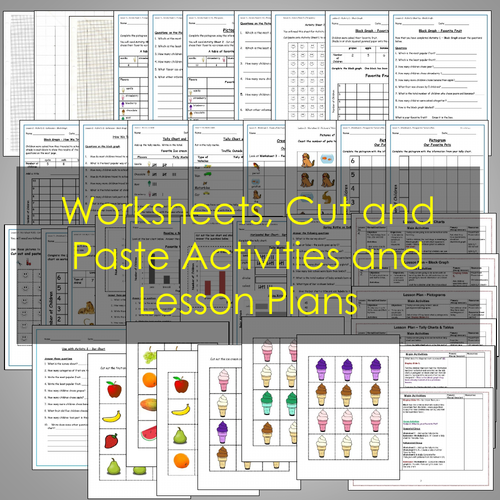
Worksheets and Presentations are editable, reproducible and printable.
Resources 1 and 2 - Best to print off, laminate and cut apart for reuse.
Learning Objectives: Organize, represent and interpret data to draw a picture graph (pictogram), and block graph.
Represent data, solve information presented in a bar graph.
Draw scaled picture graph and bar graph to represent data set with several categories.
CCSS.Math.Content.1.MD.C.4
CCSS.Math.Content.2. MD.D.10
CCSS.Math. Content.3.MD.B.3
Now includes PDF versions.
Something went wrong, please try again later.
Amazing thank you! Easily adaptable to my SEN group<br />
A fun and delicious way to teach early elementary students how to visualize data by involving the whole class! Includes all of the necessary tools for the teacher with slideshows, handouts, and a fantastic step-by-step lesson plan!
Report this resourceto let us know if it violates our terms and conditions.
Our customer service team will review your report and will be in touch.
$4.50