

These PowerPoints form full lessons of work that together cover the new A level Maths course for all exam boards. Together all the PowerPoints include;
• A complete set of notes for students
• Model examples
• Probing questions to test understanding
• Class questions including answers
• Individual whiteboard work
• Links to exercises in ‘The Textbook by CGP’ these can easily be edited for your textbook
The PowerPoints can be used in the lesson and also given to students that have missed a lesson
I have added ‘AS level maths 13 – Circles’ for free download
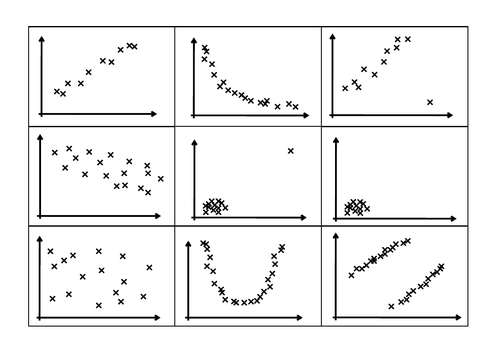
Scatter graphs covers;
- Interpret scatter diagrams and regression lines for bivariate data, including recognition of scatter diagrams which include distinct sections of the population (calculations involving regression lines are excluded)
- Understand informal interpretation of correlation
- Understand that correlation does not imply causation
- Recognise and interpret possible outliers in data sets and statistical diagrams
- Select or critique data presentation techniques in the context of a statistical problem
- Be able to clean data, including dealing with missing data, errors and outliers
Get this resource as part of a bundle and save up to 24%
A bundle is a package of resources grouped together to teach a particular topic, or a series of lessons, in one place.
Something went wrong, please try again later.
This resource hasn't been reviewed yet
To ensure quality for our reviews, only customers who have purchased this resource can review it
Report this resourceto let us know if it violates our terms and conditions.
Our customer service team will review your report and will be in touch.
£5.00