
This and all my resources are a result of many years both independent and LA consultancy, support of other teachers in schools, delivering training and a passion for science and teaching in general.
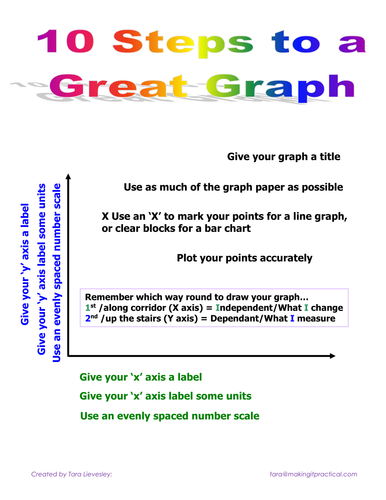
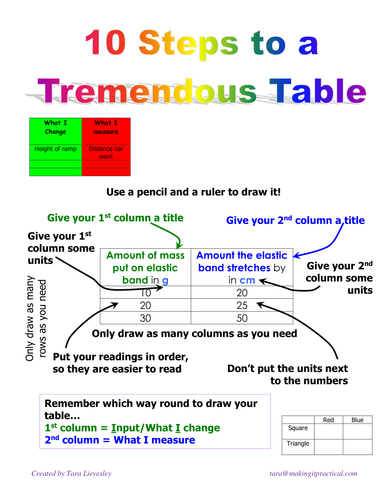
Drawing tables and graphs can be a tricky business. This resource can be used with pupils to help them remember the 10 points they need, so if you mark out of 10 then they can start to see what mistakes they have made. Obviously this can help with other subjects than science!
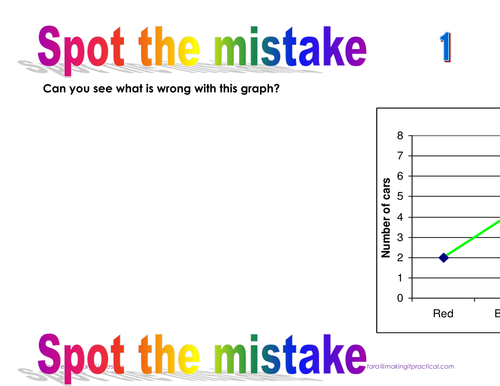
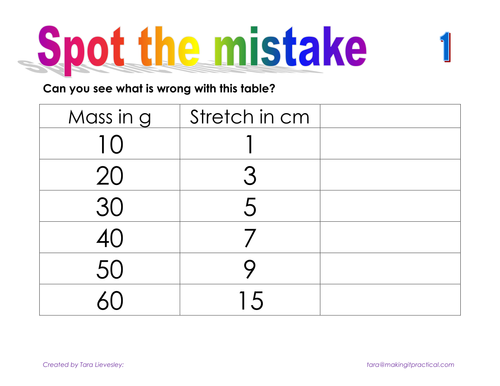
Another way to support this is with asking pupils to spot the mistakes... much easier than spotting what is correct! Here are a few examples to get you thinking and going.
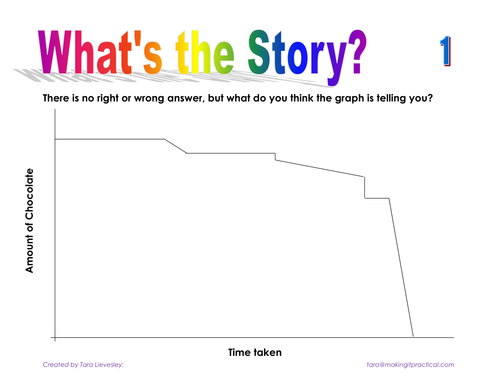
Having drawn the graph, how do you extract the information? Why not phrase it like 'telling a story'? Here are a few to get you started...
This resource is also available as a Word document (from the TES website), which is then fully editable. Contact me if you have any questions or to find out about other resources I have: tara@makingitpractical.com
Drawing tables and graphs can be a tricky business. This resource can be used with pupils to help them remember the 10 points they need, so if you mark out of 10 then they can start to see what mistakes they have made. Obviously this can help with other subjects than science!
Another way to support this is with asking pupils to spot the mistakes... much easier than spotting what is correct! Here are a few examples to get you thinking and going.
Having drawn the graph, how do you extract the information? Why not phrase it like 'telling a story'? Here are a few to get you started...
This resource is also available as a Word document (from the TES website), which is then fully editable. Contact me if you have any questions or to find out about other resources I have: tara@makingitpractical.com
Something went wrong, please try again later.
This resource hasn't been reviewed yet
To ensure quality for our reviews, only customers who have purchased this resource can review it
Report this resourceto let us know if it violates our terms and conditions.
Our customer service team will review your report and will be in touch.
£2.00