
In this series of activities on evaluating racial bias in traffic stops and searches, students calculate the probabilities of drivers of different races being searched at traffic stops, and compare their findings to census data to determine if the numbers represent random sampling or show evidence of racial bias.
For Google Docs and Slides links, please visit https://www.ctlessons.org/math/racial-bias-in-traffic-stops.html
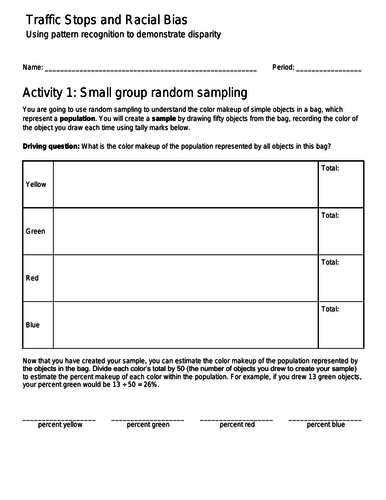
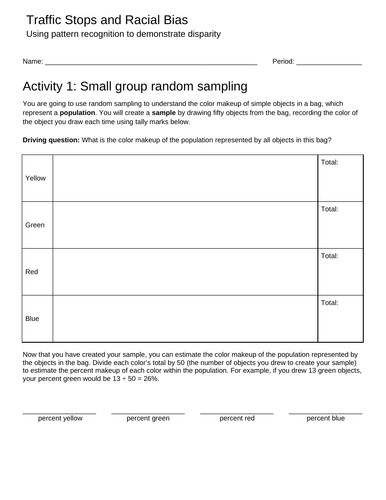
Students begin by random sampling the color of objects in a bag, combining their data with their peers’ data to increase sample size and thus decrease sampling variability. These colors map to race data of the US driving population, which students compare to real-world numbers. Students learn about their rights during traffic stops and why race matters during interactions with police. Next, they create compound probability tree diagrams with data from the Bureau of Justice Statistics to determine probabilities of being stopped by race, which they contrast with general population data.
Students interpret the data (e.g., 10% of all drivers are Black / African American, but 23% of all searched drivers are Black / African American) and form an evidence-backed conclusion about racial bias in national traffic stops. Finally, students use random sampling again to compare data for their county against their national results, bringing the issue closer to home. This project was inspired by this activity from Rico Gutstein.
Topics addressed:
Statistics and probability: random sampling, sampling variability, compound probability, tree diagrams, population sampling
Social justice context: racial bias in the police force, legal rights during traffic stops
Primary CT concept: pattern recognition. Students use real-world data to decide if there is evidence of racial bias in traffic stops and searches, computing compound probabilities and leveraging random sampling to develop their argument.
Students will be able to:
Use random sampling to estimate the makeup of a population
Reduce sampling variability by combining their data with that of their peers to increase their sample size
Create compound probability tree diagrams
Materials:
PowerPoint presentation
Student handout
Traffic stop data for your county or state from the Stanford Open Policing Project: https://openpolicing.stanford.edu/data/
Colored chips (or similar) in opaque bags for random sampling
Prep:
Create random sampling bags with 72 yellow chips, 12 red chips, 10 green chips and 6 blue chips.
Download your state’s traffic stop data from the Stanford Open Policing Project and filter it to only traffic stops resulting in searches within your county.
Create a Google Sheet document or provide another way for students to access this data.
For more information on standards alignment, please visit https://www.ctlessons.org/math/racial-bias-in-traffic-stops.html
Something went wrong, please try again later.
This resource hasn't been reviewed yet
To ensure quality for our reviews, only customers who have downloaded this resource can review it
Report this resourceto let us know if it violates our terms and conditions.
Our customer service team will review your report and will be in touch.
$0.00