
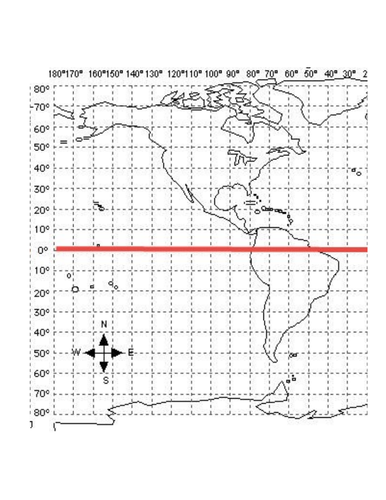
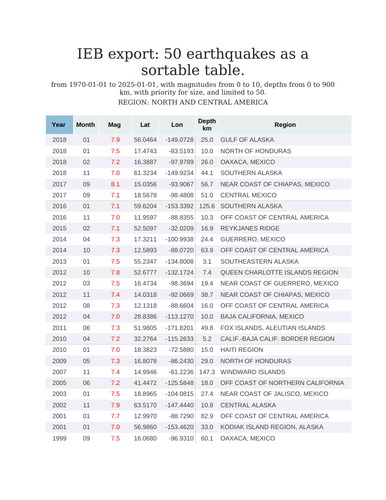
Students receive a map with latitudes an longitudes and a sheet of information with the 50 strongest earthquakes per each region. There are 6 regions. Students should locate the earthquakes on the maps. Once done this, students can make up sketch lines to discover that earthquakes are more likely to happen in plate boundaries.
Skills to be practiced: Graphing coordinates on a map.
Extended activities can include graphing the magnitudes of the earthquakes, plotting the amount of earthquakes per year.
Something went wrong, please try again later.
This resource hasn't been reviewed yet
To ensure quality for our reviews, only customers who have purchased this resource can review it
Report this resourceto let us know if it violates our terms and conditions.
Our customer service team will review your report and will be in touch.
£2.00