

Collecting, processing and representing Data
Key Stages: 3 and 4 ★
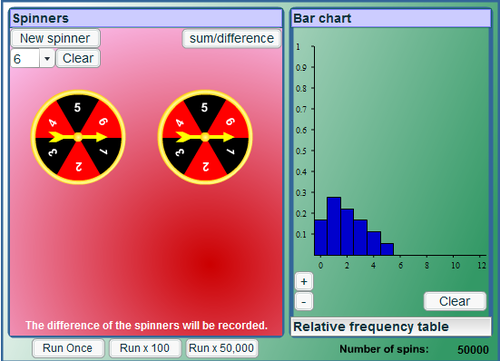
Can you use the interactivity to identify which combinations of spinners have produced the bar charts shown?
This problem provides a motivation to use sample space diagrams. The interactivity offers an ideal context in which to observe the "messy" randomness of results after a small number of experiments, and the predictability of results after a large number of trials.
The problem also offers a good starting point for considering different probability distributions and their features.
This resource has comprehensive teachers' notes and resources, linked from the problem page. This includes possible approaches and key questions, as well as possible support and extensions.
The file attached is a HTML file, which, when opened, automatically redirects you to the problem on the NRICH website.
Key Stages: 3 and 4 ★
Can you use the interactivity to identify which combinations of spinners have produced the bar charts shown?
This problem provides a motivation to use sample space diagrams. The interactivity offers an ideal context in which to observe the "messy" randomness of results after a small number of experiments, and the predictability of results after a large number of trials.
The problem also offers a good starting point for considering different probability distributions and their features.
This resource has comprehensive teachers' notes and resources, linked from the problem page. This includes possible approaches and key questions, as well as possible support and extensions.
The file attached is a HTML file, which, when opened, automatically redirects you to the problem on the NRICH website.
Something went wrong, please try again later.
This resource hasn't been reviewed yet
To ensure quality for our reviews, only customers who have downloaded this resource can review it
Report this resourceto let us know if it violates our terms and conditions.
Our customer service team will review your report and will be in touch.
£0.00