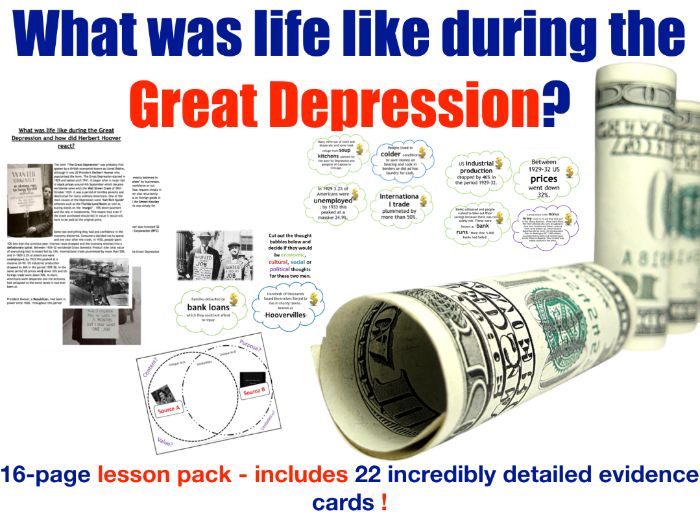
This resource features a starter in which students compare two sources on life in 1930s USA using a VENN diagram. The PowerPoint then provides some background information before inviting students to break down 22 factor-led thought bubbles into columns (these are colour-coded into social, economic, cultural and political). Students then use this information to create a written account of what life was like before concluding with a fun singing plenary. I really enjoy delivering this lesson (partly because Hoover is my favourite US President!) and hope you find it useful!
Something went wrong, please try again later.
This resource hasn't been reviewed yet
To ensure quality for our reviews, only customers who have purchased this resource can review it
Report this resourceto let us know if it violates our terms and conditions.
Our customer service team will review your report and will be in touch.
£9.99