

Year 2 – Spring – Week 1 – Statistics Differentiated Sheets
Week 1
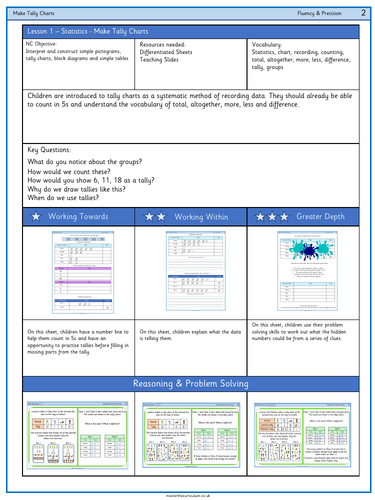
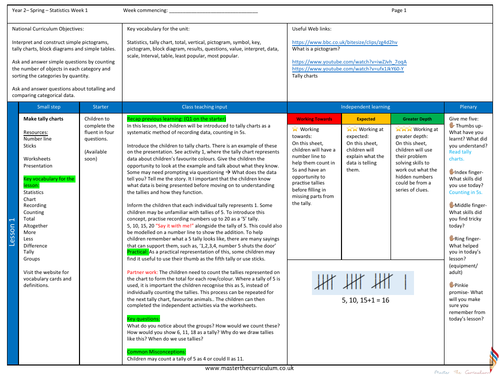
L1 make tally charts – complete the tally chart
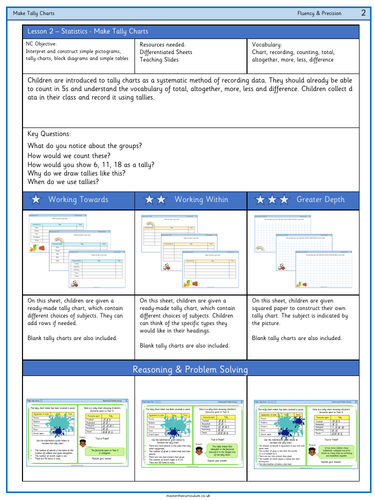
L2- collect data in class
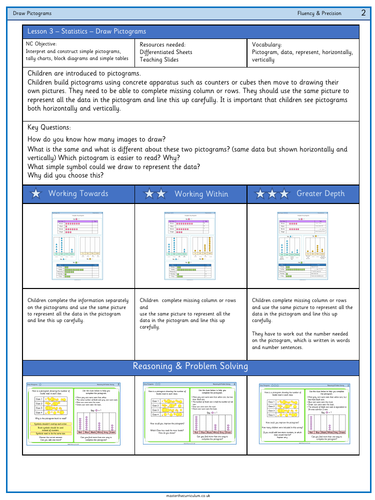
L3 – draw pictograms
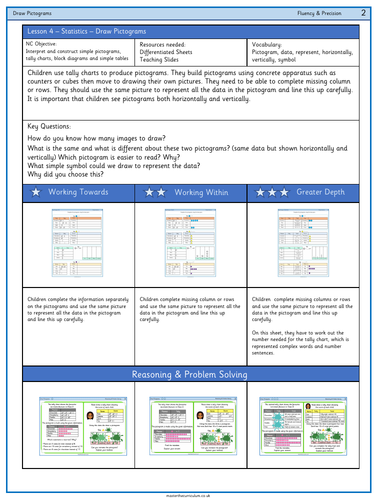
L4 -draw pictograms- using a tally
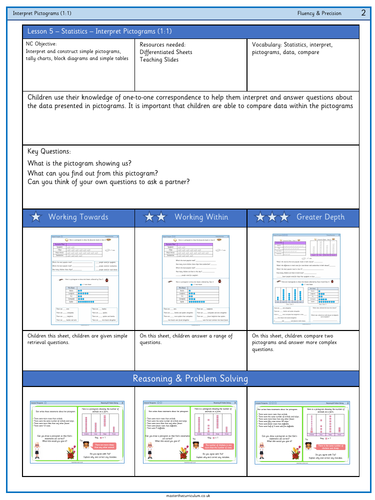
L5 interpret pictograms
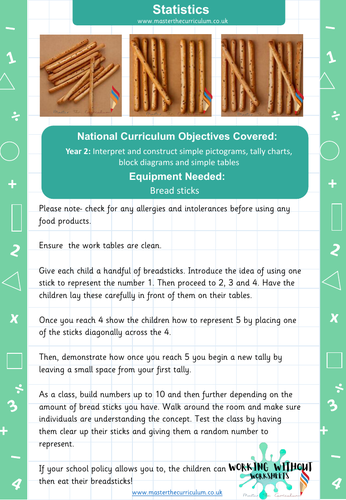
BONUS Practical ideas included!
Includes the NEW 20/21 Resources and Revision Starters
L1- Make tally charts activity
L2- Make tally charts
L3- Draw pictogram activity
L4- Draw pictograms
L5- Interpret Pictograms
Something went wrong, please try again later.
This resource hasn't been reviewed yet
To ensure quality for our reviews, only customers who have purchased this resource can review it
Report this resourceto let us know if it violates our terms and conditions.
Our customer service team will review your report and will be in touch.
£6.00