


Recent
Most read
Most shared

A-level results day returned this year - and it was almost like things were back to normal.
Of course, we can only say almost, as this year despite exams taking place in person, the fingerprints of the pandemic are still all over the results tables and charts.
Not least because Ofqual took steps to reduce the grade inflation that saw record high grades in 2021 when teacher-assessed grades (TAGs) were used.
However, the 2022 grade boundaries have been a little more lenient than in 2019, the last time in-person exams were used. What’s more, students had mitigations - such as advanced knowledge of what would be covered in exams.
So did those mitigations used by exam boards have the desired impact? And what do the results tell us about this year’s cohort and the impact the pandemic has had on learning? We look at the key trends from results day…
Ofqual’s plan to reduce grades as part of their graduated return to pre-Covid standards meant that the drop in grades was forewarned.
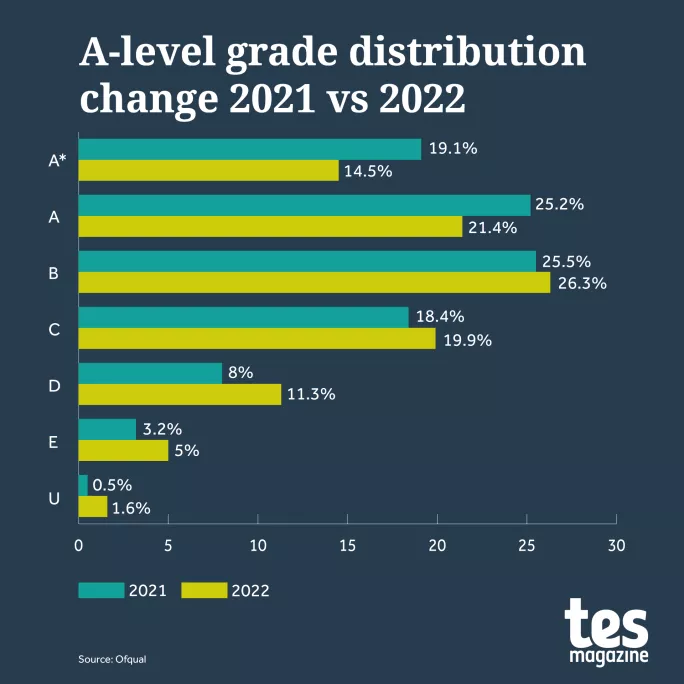
This means that compared with 2021, the overall pass rate for A*-C was 82.1 per cent, down from a record-breaking 88.2 per cent the year before.
However, this was still up from 75.5 per cent in 2019, the last comparable year of “normal” exams.
As we can see from the chart below, the reduction happened almost entirely at the top end, where the average number of A grades fell and the number of grades B-U all increased as a result.
Next year’s results will likely follow a similar pattern as the exams regulator works to bring things back to 2019 levels.
Sam Tuckett, senior researcher for post-16 education and skills at the Education Policy Institute (EPI), said it appeared the glide-back plan had gone well.
“Given the need to return to exam-based assessments in the long-term, the government’s gradual, multi-year approach seemed the most appropriate,” he added.
A dip at the top end and growth at the bottom has had to happen to allow a return to a typical pre-Covid distribution of grades, but doing this has raised questions over the impact on the number of students who have applied for university - and who will consequently miss out on offers.
At first glance, it appears that despite the reduction in higher grades, students are still continuing on to their chosen institutions, with the Department for Education reporting that nearly 180,000 18-year-old students in England have had their place at their first choice of university confirmed - a healthy 20 per cent increase compared with the last in-person exams.
Over the next few days, as places in clearing are taken and final courses are confirmed, we will find out more about whether these adjustments have had an impact on movement onto higher education this year.
While the glide back has mostly worked, it is clear the impact of this has not been felt equally, with grades in the South East of England especially seeing less of an impact when compared with the North and North East.
The difference in performance is particularly stark at the top end of the grades, as this table shows:
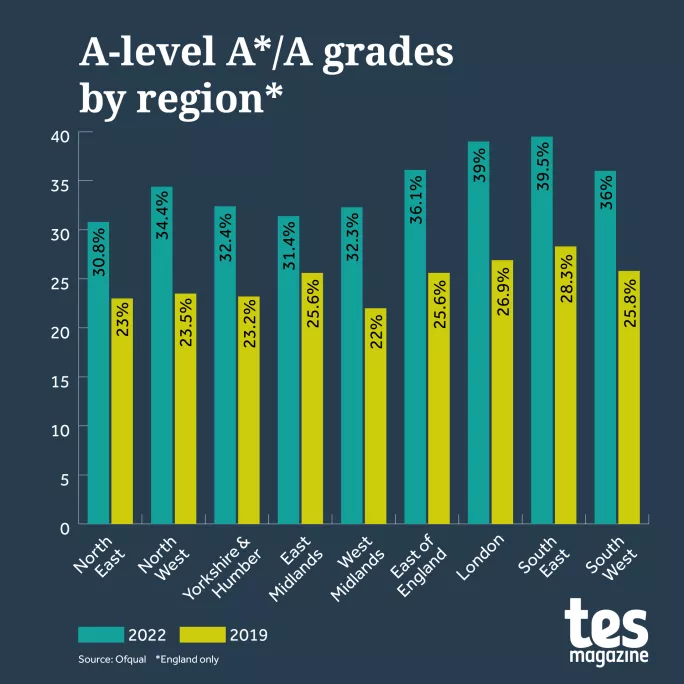
The gap between the North East, which received the lowest proportion of A* and A grades out of all the regions (30.8 per cent), and the South East, which received the highest proportion (39.5 per cent), was 8.7 percentage points this year.
This is larger than the attainment gap between the highest and lowest performing regions when A-level exams were last held in 2019, when there was a 5.3 percentage-point difference.
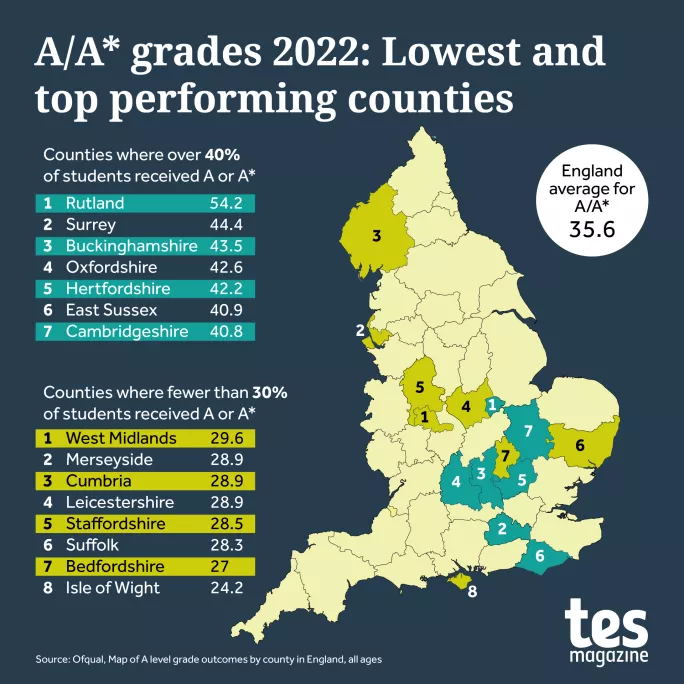
A look at the data showing the best- and worst-performing counties also shows a fairly clear north-south split.
Grading by region was being discussed as early as November 2020, and at the time was dismissed as not being a workable solution. Colin Hughes, chief executive at exam board AQA, said at the time he thought the idea was not the “best way forward”.
Hughes made the point that regional grading would lead to situations where grades would be improved for pupils who lived in regions where you have a “rundown inner-city area comprehensive and just down the road there’s a fantastic private school”.
However, after this year’s A-level results, Ofqual chief Ian Buckham expressed his feelings about the regional disparities when he claimed that no “right-thinking person would not be concerned” by regional disparities in the A-level results.
Buckham said that it was now the job of “policymakers who are responsible for making decisions about education” to “respond in a way that is appropriate”.
Tuckett agrees that the regional disparities are a “cause for concern”, and it is clear that “educational outcomes between London and the South East and the rest of England have only grown further apart since 2019”.
As such, he says greater support must be targeted at disadvantaged schools and pupils to close this gap.
Teacher recruitment and additional funding are the two key areas of need to do this, says Tuckett, and he cites a recent report by EPI that says “targeted extra funding at more deprived schools” and bringing more “policies designed to improve recruitment and retention of high-quality teachers…such as salary supplements, and access to high-quality professional development” could help deliver on this.
Although the data on disadvantaged pupils’ A-level performance has not been released, what can be seen in the regional breakdown suggests that we can expect the attainment gap to widen between advantaged and disadvantaged pupils.
However, what is pleasing to see is that more disadvantaged students than ever before are taking up university places.
Even before students entered the exam halls to take their A-level exams, we knew there had been an increase in the number of students from disadvantaged backgrounds applying for university.
In the aftermath of the results, the Department for Education has released data that it says shows the gap between the most and least advantaged progressing to university has narrowed to a record low, falling from 2.32 in 2021 to 2.26 in 2022.
Carl Cullinane, head of policy and research at the Sutton Trust, says that any rise in disadvantaged students going to university is to be welcomed - not least because studies have shown when state pupils go on to study at university, they often outperform their privately educated peers.
The study by Cambridge University revealed that if a student was from a comprehensive school, they were more likely to achieve either a first-class or at least an upper-second-class degree than their peers from independent schools who arrived with similar A-level grades.
There is no doubt that policymakers will be waiting to see if the increase in disadvantaged pupils gaining places at university will follow this trend, and gives further impetus to why ensuring all pupils have access to higher education is so important.
For some years, the number of students taking four A levels had been declining.
In 2016, a total of 18,450 students took four exams, but this fell to 15,500 in 2017 and then to 13,700 in 2018. In 2019, it was just 10,600.
Much of this has been attributed to a fall in funding for A levels, which has made it harder for schools to support students who want to study for more exams.
However, the tide has been turning. In 2020, a total of 10,785 pupils took four A levels, and it rose again in 2021 to 12,735. This year has seen another increase to 13,135.
It still only equates to just 4.8 per cent of the total, but shows that an appetite for extra exams is there - perhaps seen as a way to stand out from the crowd for university applications or future career aspirations - or maybe simple for a love of learning.
Meanwhile, it is also notable that Ofqual data for 2022 also revealed that 185 students took five A levels, while a particularly hardy bunch of five students took six A levels. Here’s hoping they got the grades they wanted.
As was previously expected, English literature’s decline in popularity continued - so much so that it dropped out of the top 10 most popular A-level subjects for the first time ever.
This was caused by a 9.4 per cent fall in candidates taking the subject - from 39,492 in 2021 to 35,791 this year.
As previously reported by Tes, this decline is caused by both girls and boys turning their back on the subject - with reasons ranging from the perceived lack of future career earnings from studying English to pupils being put off by GCSE English literature courses.
However, Derek Richardson, vice-president of Pearson UK, which owns exam board Edexcel, says that it seems more a case of a new generation of students being engaged by different subjects.
”[It is] clear that students today are interested in following different subjects than subjects that I was taking when I was doing my A levels,” he says. “So things that students are interested in studying change over time and that seems to be what’s happening at the moment.”
However, Geoff Barton, general secretary of the Association of School and College Leaders, says this shows that the GCSE English literature curriculum needs to be “urgently reviewed” in order to revamp the course and help “stop the spiral of decline we are seeing at A level”.
Tuckett agrees, and says that “consideration should be given to ensuring the course allows for engaging teaching and remains attractive to students, not least to avoid any potential threat to the pipeline of English teachers of the future”.
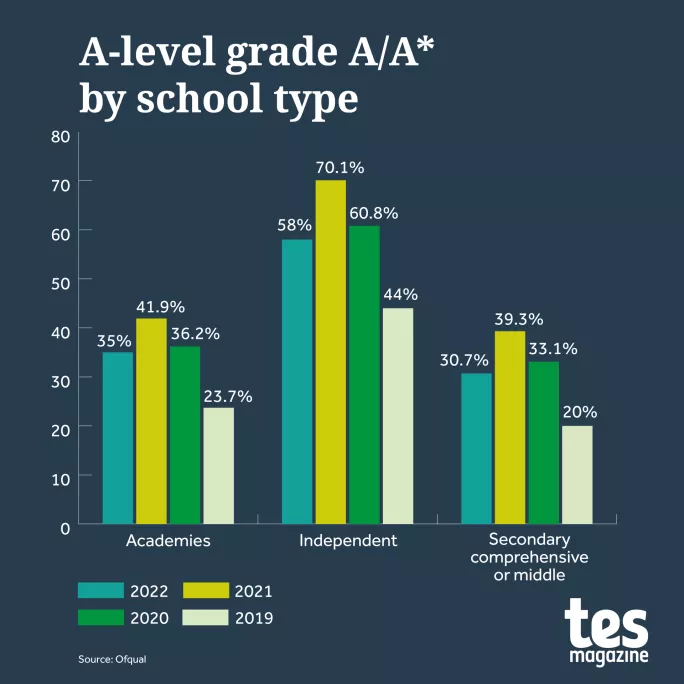
In 2021, there was a huge upsurge in the proportion of A* grades awarded to private school students, with 70 per cent achieving an A or A*.
This has fallen dramatically in 2022 though, to 58 per cent, narrowing the gap with the state sector.
Cullinane says it was “good to see the state vs private gap reduced [because] it ballooned in 2021”, and that bringing them back closer together was important if any attempt to close the disadvantage gap is to have an impact.
This sentiment was echoed, perhaps surprisingly, by Barnaby Lenon, chair of the Independent Schools Council (ISC), who said the drop in top A-level grades at private schools was no cause for alarm.
“Independent schools have such a high proportion clustered in that A/A* bracket and it’s quite right that there should be a correction this year,” he said.
However, given the gap remains at 23 per cent for academies and 28 per cent for maintained schools, it is clear there is still a huge gap between those in private schools and those in the state sector when it comes to achieving the highest grades possible.