
Recent
Most read
Most shared

I would like to address the measures currently in place for comparing the performance of local authorities, particularly for the attainment of those pupils who are from disadvantaged backgrounds (“Attainment gap narrower ‘in more-deprived areas’”, Insight, Tes Scotland, 24 March).
According to data contained within the Local Government Benchmarking Framework (LGBF), it would appear that those pupils within Aberdeenshire Council from more disadvantaged backgrounds do significantly less well when compared with similar groups of pupils across the country. This is simply not the case.
The figures used in the LGBF do not take into account the variations in the percentage of students leaving after S4, S5 and S6. The measure is based on attainment at the end of S6 and, obviously, the longer students stay on at school, the more chance they have of attaining further qualifications.
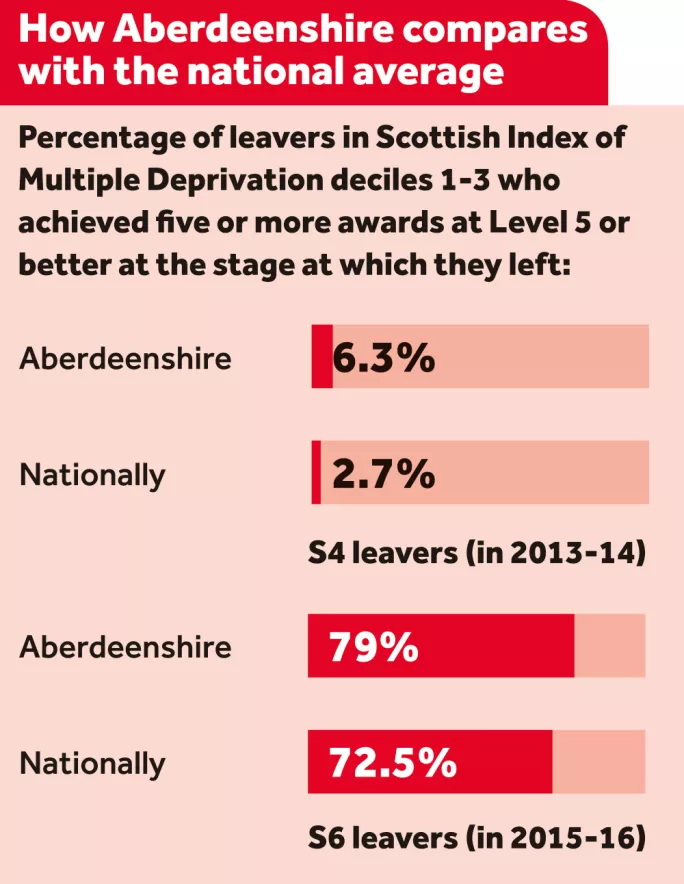
If Aberdeenshire is taken as an example, less than 2 per cent of students appear in “Quintile 1”, which is being compared with other “similar” local authorities. Of this group of 52 students, 38 per cent are leaving school in S4 (mostly to positive destinations) within Aberdeenshire, whereas the national figure is 17.2 per cent.
This means that proportionately fewer of the pupils within the group who are being measured are staying on to S5 and S6, where they would have more opportunity to achieve the requisite number of awards. In fact, by S6 (the point at which the measure is taken), only 17.3 per cent of Aberdeenshire students within this group were still at school compared with 51.4 per cent nationally. It is very clear that no valid comparison can be made on this basis.
Attainment statistics, which are based on a historic cohort and collect attainment over a period of years, but which do not take into account the effect of variations in the proportions leaving at each stage, must always be interpreted carefully if meaningful comparisons are to be made. The impact of this on attainment is evident for all cohorts of students, but can be magnified if the focus is on a particular sub-cohort, such as the cohort in Scottish Index of Multiple Deprivation (SIMD) Quintile 1.
A more realistic and fairer way to compare these groups of pupils would be to calculate their attainment for each year stage when they leave school.
In the measures discussed above, this paints a completely different picture. If a comparison was made between the pupils from deciles 1-3 in Aberdeenshire and nationally (the groups referred to in the LGBF), it would appear as shown in the box below.
This would be consistent with the overall attainment trends within Aberdeenshire, which has seen consistent and significant improvement since 2014.
While we are all seeking a fairer way of demonstrating pupil achievement - a way that motivates all learners to achieve to their fullest potential - we must be very aware that incorrect reporting can lead to uncertainty and lack of confidence in parts of our systems where issues do not exist.
In the case I make above, to create a focus on a group of pupils due to information obtained from LGBF data would be the wrong thing for this local authority at this time.
While we acknowledge that, like the rest of our country, there is a clear correlation between attainment and deprivation, our approach must be considered, proportionate and take into consideration the local context.
In my own experience as a headteacher working in a deprived area in the north-west of Glasgow for many years, and now working in Aberdeenshire, I have an acute appreciation of different forms of deprivation and how they affect young people’s life chances. It is not that one is more important than another, it is just that they are different.
It remains our job to identify barriers to learning and ensure that all pupils, regardless of their background, have an equal chance to achieve all they can. Perhaps the broad-brush attempt to quantify and address the needs of all learners in our country is no longer valid. There now exists a need to better understand the needs of the individual and the context within which they operate.
The potential misunderstanding of the current position within Aberdeenshire, given the challenges that already exist across the education sector, could divert energy and effort from areas where it could be better used.
While we accept that there is work to be done in closing the attainment gap within this council area, it is by no means more pronounced than the rest of the country, as the data within the LGBF document would have suggested.
It is extremely valuable to have information collated that reflects how local authorities are performing in the delivery of services to communities; indeed, the interrogation of this data builds a really useful understanding of why performance variations occur.
There will be many cases where further explanation of statistics allows deeper understanding of underlying issues, and the LGBF creates such opportunities. I fully support this - but, equally, I feel compelled to highlight anomalies where they exist.
Vincent Docherty is head of secondary education and additional support at Aberdeenshire Council