Handwritten notes on the new syllabus for IBDP Maths for 2021 - Applications and Interpretations SL (A&I SL). It is 52 pages - 8 on Algebra, 10 on Functions, 8 on Trig, 17 on Statistics, 9 on Calculus.
Each topic is carefully organised, with the subtopic numbers very clearly marked on each page, related to the exact numbers given in the official syllabus document.
The first topic is available for free here, if you want to give it a preview before buying the whole thing.
I have also finished the A&A SL & HL notes as well.
These PowerPoints form full lessons of work that together cover the new AS level Further Maths course for the AQA exam board. Together all the PowerPoints include;
• A complete set of notes for students
• Model examples
• Probing questions to test understanding
• Class questions including answers
• Individual whiteboard work
• Links to exercises in ‘AQA approved textbooks by Camb uni Press’ these can easily be edited for your textbook
The PowerPoints can be used in the lesson and also given to students that have missed a lesson
I have added ‘Further Maths 5 - Matrices Transformation’ and ‘Further Maths 23 - Network Flows’ for free download
Please leave a review as it will really help me to improve my resources
These PowerPoints form full lessons of work that together cover the full A level Further Maths course for the AQA exam board. Together all the PowerPoints include;
• A complete set of notes for students
• Model examples
• Probing questions to test understanding
• Class questions including answers
• Individual whiteboard work
• Links to exercises in ‘AQA approved textbooks by Camb uni Press’ these can easily be edited for your textbook
The PowerPoints can be used in the lesson and also given to students that have missed a lesson
Videos of the lessons are all on You Tube so you can see the PowerPoint lessons fully first
Please leave a review as it will really help me to improve my resources
This lesson has been designed to help A Level students with Spearman’s Rank and Chi Squared test, by going through an example of each step by step.
In addition there are some slides discussing when to use the test and what some of the pros and cons are.
This typically takes up an hour lesson and the students do find it useful going through it step by step.
Slide 14 can be printed off and handed to the students and the word document is the chi squared example handed out to students.
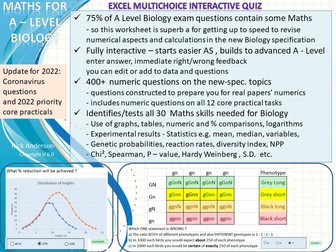
Did you know that 75% of A Level Biology questions now contain some Maths content from 30 different numerical techniques? This 350+ question multi-choice quiz assembles all the Biology numeric calculations all in one place, and will help with revision and prepare you for the new specification A Level exam.
Some good A Level Biology students lose marks because they are worried by the maths - but with practice and confidence it can be mastered. This interactive quiz identifies your right answers and also points to gaps in a scored checkout test. I also run an on-line course to support this.
Maths for A Level Biology covers obvious requirements like mean, interpreting graphs, rounding, percentage change and standard form; but also extends for example to:
genetic probabilities, reaction rates, diversity index, NPP and statistical tests like Chi², Spearman, P – value, Hardy Weinberg , Also questions on variables and results in the 12 core practical experiments. In fact anything that involves a number!
When you enter an answer by clicking, entering a,b,c or a number you get an immediate correct/try again colour coded answer. There is a reset button to start again. You can add questions with just a modicum of Excel skills.
In the very latest V 6.0 version more questions have been added reflecting the most up to date papers’ question style and also Coronavirus and COVID-19.
And for 2022 an indication of priority A Level practicals.
A step - by - step guide to using statistics in geography fieldwork.
Clear, concise guide to using statistics in geography.
Including;
Null hypothesis
Correlation
Spearman’s rank
Chi squared
Mann Whitney U tests
All with worked examples.
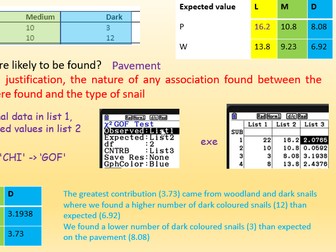
Lessons on chi squared hypothesis testing with contingency tables using the casio calculator to get expected values.
Includes pooling and Contributions
Inlcudes worksheets and solutions
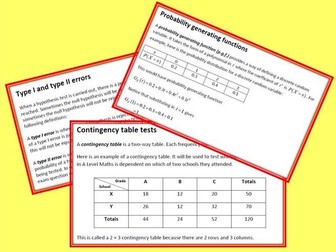
These comprehensive notes and examples cover the Further Statistics 1 (FS1) unit of the Edexcel new A Level Maths specification. Student booklets are provided for each topic in both Word and PDF formats. There are also teacher booklets for each topic containing detailed worked solutions.
The chapter titles are: Discrete Probability Distributions, Poisson and Binomial Distributions, Geometric and Negative Binomial Distributions, Hypothesis Testing, The Central Limit Theorem, Probability Generating Functions, Quality of Tests (Type I and Type II Errors).
Also available: Edexcel Further Core Pure Notes and examples for the new specification (years 1 and 2):
https://www.tes.com/teaching-resource/edexcel-further-core-pure-as-11890483
https://www.tes.com/teaching-resource/edexcel-further-maths-year-2-core-pure-11931638
Edexcel Further Mechanics 1 (FM1) Notes and examples for the new specification:
https://www.tes.com/teaching-resource/edexcel-further-mechanics-1-new-spec-11998238
Chi-Squared Tests for Goodness of Fit
This 58 slide PowerPoint presentation covers the content of “Chi-squared Tests” within Edexcel Further Statistics 1 (Chapter 6 of the official Pearson FS1 textbook).
Each slide is accompanied by teacher notes.
[A free preview PowerPoint slideshow, containing approximately half the slides, is also available.]
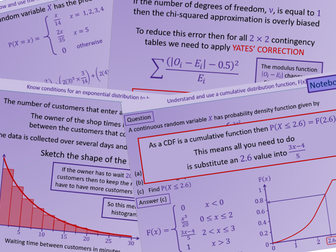
We start with a general introduction for how you quantity the closeness of observed frequencies to the frequencies expected for a chosen standard distribution i.e. how to calculate Pearson’s Cumulative Test Statistic, X^2.
Both methods of calculating X^2 are covered.
In order to properly understand the concept of “Degrees of Freedom”, additional examples are included to fully explain how we determine the degrees of freedom of a given dataset by taking into account restrictions placed upon it. In my opinion, this is handled poorly by the textbook.
The loss of degrees of freedom due to having to combine adjacent columns of the dataset (because the observed/expected frequencies are too low), and because the observed data itself is needed to calculated a required parameter of the model distribution is also covered.
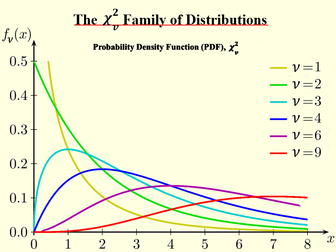
We then link this to our existing knowledge of Hypothesis Tests, and introduce the Chi-squared family of distribution. This section has also been extended to ensure that students properly understand how the chi-squared graphs vary with the data’s degrees of freedom, ν, and how to effectively these graphs (either by using the table “Percentage Points of the Chi-Squared Distribution” in the formula book or by using a calculator e.g. the Casio CG50).
Once we have the foundations in place, we use them to work through exam-style examples, comparing the given observed data to a chosen standard model distribution. For each example, we perform a hypothesis test to determine if there is sufficient evidence, at the required significance level, to reject null hypothesis.
The examples cover the following standard distributions:
Discrete Uniform Distribution
Geometric Distribution
Binomial Distribution
Poisson Distribution
_
All examples are either newly created or significantly modified from past paper questions.
For each standard distribution we explain how to determine the probability of each outcome and, hence, the expected frequencies. We also explain how to, if necessary, estimate a required parameter (e.g. ρ for the Binomial distribution, λ for the Poisson Distribution) from the observed data.
The presentation, unlike the textbook, deals with the four standard, discrete distributions in turn i.e. it does not delay the section on the Geometric Distribution until the end. Instead, the section on continency tables is left to the end and given its proper title of “The Chi-Squared Test of Independence”.
In addition, the presentation contains detailed examples showing how to use the Casio CG50 calculator to perform Chi-Squared tests.
Regards
Gerard
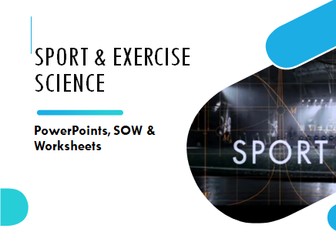
A fantastic resource for those teaching BTEC Sport. This resource includes starter activities and plenary tasks, differentiated learning objectives, tasks with differentiation, employability tasks, Maths and English tasks included (where possible). The resource is very interactive and has been put together by a series of teachers to improve the consistency.
The main PowerPoint itself contains over 300 slides and there are attached worksheets which helps the delivery of the Unit.
The unit has been broken up into the following theory lessons:
*Key Issues
*Quantitative/Qualitative
*Classifications of Data
*Ethical Issues
*Research Designs
*Qualitative Data Analysis
*Quantitative Data Analysis
*Graphs in Sport Science
*Excel
*Hypothesis
*Independent t-test
*Chi-Squared t-test
Topical question are an essential tool for any student looking to succeed in their exams. These questions are similar to regular past paper questions, but instead of covering all topics, they focus on a specific topic or theme. This allows students to test their knowledge in a more targeted way and identify any areas they may need to improve on. By practicing with Topical Past Papers, students have the opportunity to enhance their understanding of a subject and build their confidence ahead of the exam.
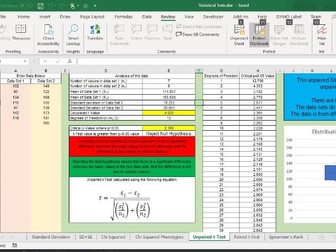
Interactive powerpoint and spreadsheet to demonstrate and calculate the following statistical functions required for A Level Biology:
Standard Error
Standard Deviation
Chi-Squared for ecological studies
Chi-Squared for phenotype ratios
Student’s t-test for unpaired data
Student’s t-test for paired data
Spearman’s Ranked Coefficient of Correlation
Where degrees of freedom and p=0.05 confidence levels are used they are automatically calculated from the inputted data and an indication is shown as to whether a null hypothesis for the data is to be accepted or rejected.
The power point goes step by step through each statistical test, describing how to use it, how to calculate each one and what the results mean.
The work sheet contains exam style questions and answers upon chi-squared which is covered with a step by step explanation at the end of the power point.
A watermarked preview video if the ppt can be found at https://youtu.be/1LcW3EO0MpU
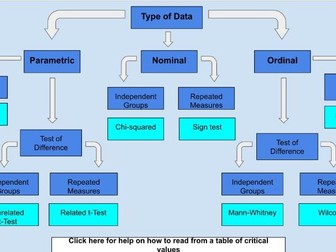
This interactive flowchart helps you decide which statistics test to perform based on the type of data you have and what you are looking for.
If you click on each of the categories it brings up a help bubble with a descriptor of what it means.
If you click on each statistical test it brings up a complete worked example of how to perform that test.
It also includes a help sheet and example questions on reading from a table of critical values.
My students have found this invaluable in helping them navigate which test to use, but also as a visual display to aid their memory.
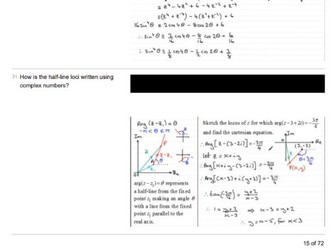
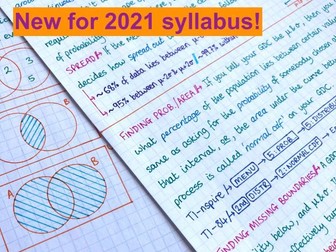
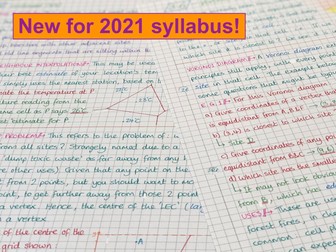
This resource has handwritten notes for the fourth topic of the new Applications and Interpretations SL course (statistics and probability), for first exams in 2021. There will be significant overlap with the A&A Topic 4, and this is a subset of A&I HL Topic 4. I wrote and sold notes for the current IB courses, which have been fairly successful, so I am in the process of writing notes for the new courses, from scratch.
If you want a preview, try the first topic of the course for free
My hope is that if these notes seem helpful, please ‘follow’ my shop, so you will be notified when the remainder of the notes become available. Please let me know if you have any feedback or improvements that could be made.
This topic includes:
4.1 - Basics
4.2 - Presentation of Data
4.3 - Averages, Dispersion
4.4 - Regression, Correlation
4.5 - Probability Basics
4.6 - Venns, Trees, Combined Probability
4.7 - Discrete Random Variables
4.8 - Binomial Distribution
4.9 - Normal Distribution
4.10 - Spearman’s Rank
4.11 - Statistical Testing
Whole course notes are already complete for:
A&A SL
A&A HL
fantastic resource for those teaching BTEC Sport. This resource includes starter activities and plenary tasks, differentiated learning objectives, tasks with differentiation, employability tasks, Maths and English tasks included (where possible). The resource is very interactive and has been put together by a series of teachers to improve the consistency.
The main PowerPoint itself contains over 800 slides and there are attached worksheets which helps the delivery of the Unit. The Research Project unit has been combined with Analysing Sports Performance but they can be separated if possible. You also have access to Research Methods lessons.
 Quick View