 Quick View
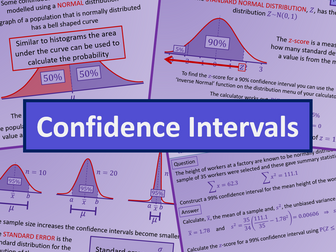
Confidence intervals - AS level Further Maths Statistics
These PowerPoints form full lessons of work that together cover the new AS level Further Maths course for the AQA exam board. Together all the PowerPoints include;
• A complete set of notes for students
• Model examples
• Probing questions to test understanding
• Class questions including answers
• Individual whiteboard work
• Links to exercises in ‘AQA approved textbooks by Camb uni Press’ these can easily be edited for your textbook
The PowerPoints can be used in the lesson and also given to students that have missed a lesson
I have added ‘Further Maths 5 - Matrices Transformation’ and ‘Further Maths 23 - Network Flows’ for free download
Please leave a review as it will really help me to improve my resources
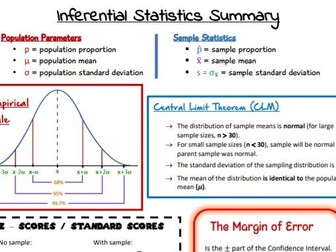
Statistics – Confidence intervals covers;
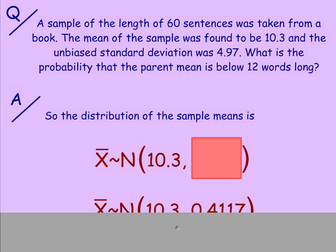
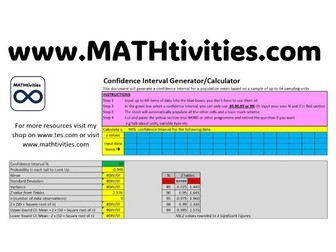
Construct symmetric confidence intervals for the mean of a normal distribution with known variance
Construct symmetric confidence intervals from large samples, of the mean of a normal distribution with unknown variance