 Quick View
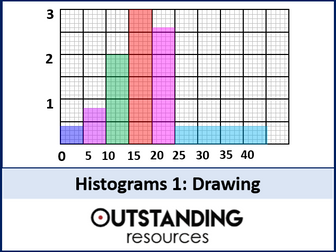
Plotting or Drawing Histograms
This is a whole lesson introducing the topic of Histograms. I have a follow-up lesson building upon this one by interpreting histograms and solving problems. This lesson is ready to go, with no prep required. It is also great for home learning. 20 slide presentation + 2 worksheets.
The lesson includes :
+ a starter (a bit of fun looking at why most people can't draw a bar chart)
+ learning objectives (differentiated)
+ keywords
+ very clear teaching slides (highlighting the difference with bar charts, what histograms are and why we use them)
+ very clear examples of how to calculate the frequency density and how to draw histograms
+ a worksheet (rich task) with answers
+ additional worksheet (with answers)
+ plenary (Quick Matching Exercise)
ALL LESSONS on Statistics in one BIG Bundle:
Statistics: All Lessons + All Resources
LASTLY:
This lesson is flat packed for copyright purposes.
Please provide a RATING with written feedback.
Please email outstandingresourceshelp@gmail.com if there are any issues and we will respond within 48 hours.