This resource is a lesson workbook with questions on:
Graph plotting
Spotting anomalies in graphs and tables
Calculating the mean of a data set
Key definitions (including variables, accuracy, precision etc)
Drawing lines of best fit
There is a full answer set for every page of the workbook. The workbook is designed to test how data is manipulated and displayed with an emphasis on spotting trends in data.
1 session on PPT on how to interpret pie charts. Includes printable maths mastery resources progressing through: Fluency, Reasoning and Problem solving progression activities on slides.
A collection of 20 well thought out GCSE maths worksheets with answers carefully designed to help students aiming for grade 4.
Thorough, comprehensive and structured to increase in difficulty gradually, beginning with scaffolded intro examples and building up to challenging extension questions that really get them thinking.
Bundle includes (with links to free previews):
Angles in parallel lines
Angles in polygons
Averages from a frequency table
Changing the subject
Cylinders
Estimating with probabilities (relative frequency)
Expanding single brackets
Expanding double brackets
Factorising (into single brackets)
Factorising quadratics
Index laws
Linear sequences (nth term)
Percentage increase and decrease
Primes and prime factorisation
Pythagoras’ theorem
Scatter graphs
Solving equations
Solving linear inequalities
Surface area of cuboids and prisms
Note: Because TES bundles contain a maximum of 20 resources this is not a complete list of all grade 4 topics. The remaining grade 4 topics can be found in Bundle 2.
Please note the PNG files are photos that have been used for the previews only. They are not the documents needed to use the resource, they only photos of what is included.
This bundle includes all the topics needed to teach functional skills. All topics for the reformed functional skills qualifications that are included have work books many differentiated to L1 & L2 . Lots of power points and the majority of answers are also included. This really is a bargain.
My exam board is city and guilds. But this would be useful for all exam boards.
Every work book Included is made for the reformed functional skills maths and include calculator and non calculator methods.
Place Value
Rounding and estimation
Multiply by 10,100,1000 and add and subtract including decimals.
Multiplication including decimals
Bidmas
Percentages of amounts, increase and decrease, reverse percentages and compound interest.
Fractions of amounts, simplify fractions mixed fractions, add and subtract fractions.
converting between fractions,decimals and percentages
Ratio and proportion
Averages
Probability
Graphs and charts
Area and perimeter including problems
Substitution into formula
Angles, symmetry and bearing,compass points and coordinates
Metric and imperial conversions
Scale plans, maps, nets ad elevations
L1 non calculator work book
L2 revision workbook with calculator and non calculator questions on every topic.
Please note if you do find typos the workbooks are in word so you can easily amend. I am going through and fixing them as I find them or they are reported to me.
Please see my resources (jonesk5) for the following available for free:
Division workbook
Course outline
Non calculator revision mock
time and timetables
This is a huge bundle of resources covering many of the topics studied in Year 1/ AS year of the OCR A Biology course.
Due to the similarities with other A level specifications this bundle would be well suited to other exam boards too.
Topics covered include:
1.) The heart and circulation
2.) The cardiac cycle
3.Chromatography
3.) Nucleic acids
4.) Protein synthesis
5.) Mitosis and meiosis
6.) Cell structure
7.) Transport in plants
8.) Statistics for biologists
9.) Prokaryotes
10.) Biochemistry: Carbohydrates
11.) Biochemistry: Lipids (Trigylcerides)
12.) Biochemistry: Proteins
13.) Biochemistry: Water and it’s properties
Answer sheets are provided for all resources included in this bundle
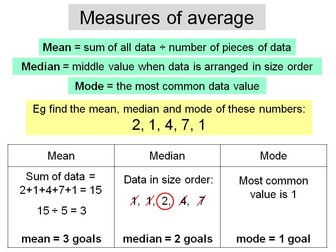
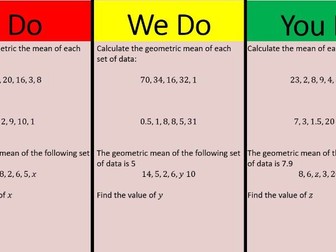
A complete lesson for introducing mean, median and mode for a list of data.
Activities included:
Mini whiteboard questions to check pupil understanding of the basic methods.
A worksheet of straight forward questions.
Mini whiteboard questions with a progression in difficulty, to build up the skills required to do some problem solving...
A worksheet of more challenging questions, where pupils are given some of the averages of a set of data, and they have to work out what the raw data is.
Some final questions to stimulate discussion about the relative merits of each average.
Printable worksheets and answers included.
Please review it if you buy as any feedback is appreciated!
The task is designed to be an open lesson were students have freedom to choose where they want to go from the destinations. Both if you have time. It is a chance for students to discuss the fundamentals of booking a holiday as well as incorporating maths. Students will feel like they have achieved something even if they do not finish the whole task as each smaller task is designed individually and only impacting the final holiday cost at the end. Tasks included:
TASK AND MATHS TOPIC
Flights and Accommodation- Reading from a table
Vouchers- Percentages
Weather- Mean and Range from bar charts
Luggage and Weather conversion- Function Machines
New York Day trip- Time Planning
Florida Day trip- Route Planning
Filling in booking form- General Number. (Adding/Dividing/Multiplying)
SUITABLE FOR high school lower and higher maths ability. functionals skills.
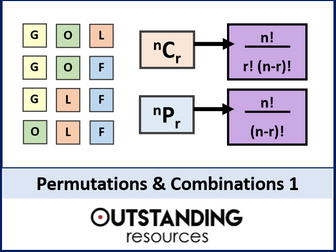
This is a whole lesson introducing the topic of Combinations and Permutations. The lesson focuses on understanding the difference, when to use them and how to use the formulas. This lesson is ready to go, with no prep required. It is also great for home learning. 27 slide presentation + additional resources.
It comes with:
a starter (getting pupils to think about the topic)
lesson objectives (differentiated)
key words
very clear teaching slides
excellent examples
MWB activities (for AFL)
Worksheet (with answers)
handout - to support students and great for student notes
a Plenary
ALL LESSONS on Statistics in one MEGA BIG Bundle:
Statistics: ALL Lessons + All Resources
LASTLY:
This lesson is flat packed for copyright purposes
Please provide a RATING with written feedback
Please email outstandingresourceshelp@gmail.com if there are any issues.
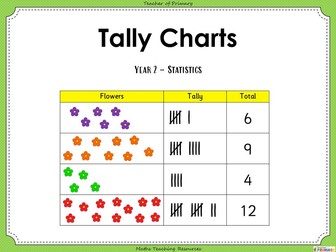
Tally Charts - Year 2
In this Year 2 statistics teaching resource, pupils will learn how to interpret and construct simple tally charts as per the curriculum objectives of the maths Year 2 Programme of Study - Statistics. Content includes:
1. PowerPoint teaching presentation
2. Activities to support the teaching of this objective with 2 accompanying worksheets
3. Three further differentiated worksheets with answers
‘Tally Charts - Year 2’ can be edited allowing teachers to adapt the resource if needed to suit each class they teach.
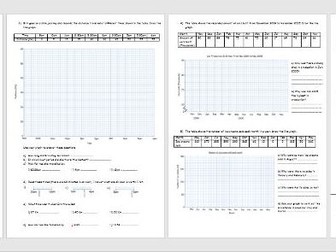
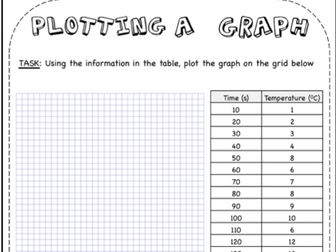
A student friendly resource for drawing and interpreting line graphs which progresses. There are 6 available typical questions to plot and interpret. There is enough here for a lesson. This is suitable for KS3 and KS4.
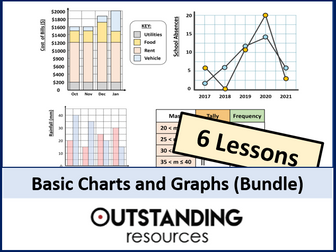
This is a fantastic 6 LESSONS on Basic Charts and Graphs.
All lessons include starters, activities, worksheets, answers, lesson objectives etc… everything you need !!
Lesson 1 - Tally Charts and Frequency Tables
Lesson 2 - Bar Charts
Lesson 3 - Composite Bar Charts
Lesson 4 - Pictographs
Lesson 5 - Frequency Polygons
Lesson 6 - Time Series Graphs and Interpreting
Please NOTE:
This lesson is flat-packed for copyright purposes, which means limited editing in places, but slides can be deleted, rearranged and slides can obviously be added.
Please provide a RATING with written feedback
Email outstandingresourceshelp@gmail.com if there are any issues and we will respond within 48 hours.
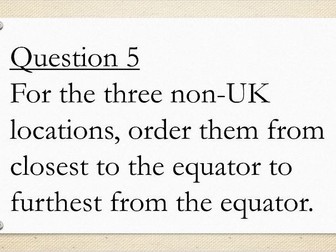
This is a quiz, split into three rounds, on the Large Data Set from Edexcel for the A Level Mathematics course.
The 3 rounds are:
• Round 1 = Locations.
Questions ensure that students know which locations are covered by the large data set and where these locations are found.
• Round 2 = Variables.
Which variables are given for each of the different locations?
• Round 3 = Units and Data
Which units are used for each of the variables and some specific questions on some anomalies in the weather or data?
The quiz is presented in a variety of formats to allow for different methods of delivery to a class:
• Just The Questions
Suitable for administering the quiz in a test format. One file has all rounds in it, and there are three separate files for individual rounds.
• PowerPoints
Two versions of each round have been provided. One where each question is given followed immediately by the answer, and one where all answers are saved until the end of the PowerPoint.
• Answer Sheets
These can be used alongside the PowerPoints, or if the test is being delivered orally.
• Questions And Answers
All questions and answers provided together, either on multiple sheets, or all on one sheet.
21 x Y6 SAT Revision PowerPoints
They have a range of KS2 reasoning and arithmetic questions that are based around topics that are likely to appear in this years KS2 SAT. Ideal for short revision sessions or quick 20 minute starters to maths sessions.
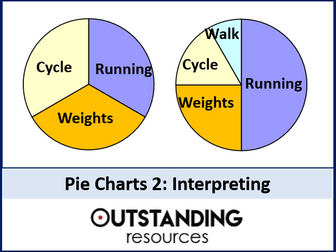
This is the 2nd lesson fantastic lesson on Pie Charts. This builds on the first lesson on drawing pie charts by looking at how to interpret (calculate frequencies) from a pie chart. This tends to be a popular exam question. This lesson is ready to go, with no prep required. It is also a great lesson for home or distance learning. Great as well for flip learning. 16-slide presentation + ORIGINAL VIDEO CONTENT + supplementary resources.
The lesson includes:
+ Starter – Matching activity (linking to why we draw pie charts)
+ Learning Objectives (differentiated)
+ Activity recapping drawing pie charts
+ Key Calculation
+ superb teaching slides
+ Lots of examples
+ FULL ORIGINAL VIDEO CONTENT (14 MINS)
+ Worksheet (with answer key)
+ Matching Activities (+ answer key)
+ Helpsheet (great for student notes)
+ Plenary
ALL LESSONS on Statistics in one MEGA BIG Bundle:
Statistics: All Lessons + All Resources
LASTLY:
This lesson is flat-packed (limited editing) for copyright purposes
Please provide a RATING with written feedback
Please email outstandingresourceshelp@gmail.com if there are any issues.
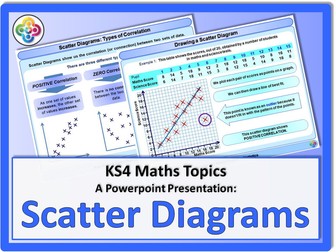
A Powerpoint to explain Scatter Diagrams. This powerpoint has 6 slides (Including one title and one end slide). Designed for KS4 / GCSE.
Topics Covered:
Scatter Diagrams: Types of Correlation
Scatter Diagrams: Line of Best Fit
Drawing a Scatter Diagram
These PowerPoints form full lessons of work that together cover the new A level Maths course for all exam boards. Together all the PowerPoints include;
• A complete set of notes for students
• Model examples
• Probing questions to test understanding
• Class questions including answers
• Individual whiteboard work
• Links to exercises in ‘The Textbook by CGP’ these can easily be edited for your textbook
The PowerPoints can be used in the lesson and also given to students that have missed a lesson
I have added ‘AS level maths 13 – Circles’ for free download
This was delivered to a low ability year 10 class. It is quite basic and missing some of the more complicated concepts dealing with Venn diagrams.
This is a PowerPoint intent on explaining how to fill a Venn Diagram with examples. I tried to include the important things to include when completing a Venn diagram. There are some generic questions contained within the slides.
Slides 1-7 were seen on lesson 1 and then I gave the class examples of this type.
Slides 8-18 were seen in lesson 2 (after recapping the previous slides) and further examples of this type were given to the class.
Any feedback would be greatly appreciated as this is my first resource I have uploaded.
Worksheets on finding averages. Includes finding averages from frequency tables .
Also includes questions on using the mean to find missing values.
Answers included.
Booklet with assessments at the start and end of the lesson on:
- Averages from a list
- Mean from a frequency table
- Mode, Range, Median from a frequency table
- Averages from grouped frequency
 Quick View