Handwritten notes on the new syllabus for IBDP Maths for 2021 - Analysis & Approaches SL (AA SL). It is 59 pages - 11 on Algebra, 12 on Functions, 8 on Trig, 14 on Statistics, 14 on Calculus.
Each topic is carefully organised, with the subtopic numbers very clearly marked on each page, related to the exact numbers given in the official syllabus document.
The first topic is available for free here, if you want to give it a preview before buying the whole thing.
I have now finished the A&A HL notes as well, and will now be working on A&I SL notes.
A pack of 5 revision worksheets - Each one containing 46 different past paper SATs style questions, all fitted onto one double sided A4 sheet
Great for keeping photocopying down whilst practising loads of past questions!There is a record sheet (including key skills) for each pupil to record their score after each attempt and try to beat it the next time! Each worksheet has similar questions & key skills but with new numbers each time in order for pupils to build confidence, fluency, and consolidate their learning.
Answers for all questions are provided (as pdf and ppt) - each on a single page which can be projected onto IWB in one go or printed out on a single sheet to allow for self/peer marking.
Could be done in class with support or at home for revision - Ideal for some intensive last minute SATs preparation. (PDF files)
This resource is now also available as part of the 2019 SATs Ultimate organiser at https://www.tes.com/teaching-resource/2019-ks2-sats-revision-ultimate-15-in-1-maths-organiser-11989842
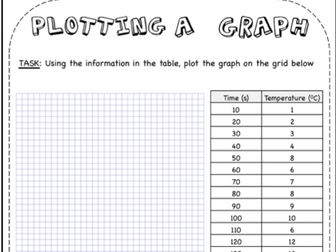
This resource is a lesson workbook with questions on:
Graph plotting
Spotting anomalies in graphs and tables
Calculating the mean of a data set
Key definitions (including variables, accuracy, precision etc)
Drawing lines of best fit
There is a full answer set for every page of the workbook. The workbook is designed to test how data is manipulated and displayed with an emphasis on spotting trends in data.
Hi there!
This is another lesson that should last around 30/40 minutes and is a maths lesson based around word problems; working out which operation to perform and when it is appropriate.
I used this as an interview lesson!
*Includes*
Lesson Plan
Learning Support sheet for TA deployment
Lesson starter activity and resources
Tables labels (great for interview lesson)
Main lesson worksheet
Worksheet answersheet for teacher
Extra word problems for starter or plenary
Presentation for Input
Happy teaching!
Miss Austin
The task is designed to be an open lesson were students have freedom to choose where they want to go from the destinations. Both if you have time. It is a chance for students to discuss the fundamentals of booking a holiday as well as incorporating maths. Students will feel like they have achieved something even if they do not finish the whole task as each smaller task is designed individually and only impacting the final holiday cost at the end. Tasks included:
TASK AND MATHS TOPIC
Flights and Accommodation- Reading from a table
Vouchers- Percentages
Weather- Mean and Range from bar charts
Luggage and Weather conversion- Function Machines
New York Day trip- Time Planning
Florida Day trip- Route Planning
Filling in booking form- General Number. (Adding/Dividing/Multiplying)
SUITABLE FOR high school lower and higher maths ability. functionals skills.
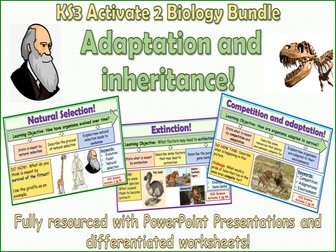
Perfect for KS3 Biology! This bundle has been created using the Activate 2 KS3 Science and the new AQA Approved Activate Science course. It comes complete with the following fully differentiated and resourced lessons:
Competition and adaptation
Adapting to change
Variation
Continuous and discontinuous
Inheritance
Natural selection
Extinction
Perfect for KS3 Science and lessons can easily be adapted for GCSE Science or even KS2 Science if needed. Lessons include engaging and detailed PowerPoint Presentations with differentiated activities, worksheets, quizzes and class practicals for students to complete.
Enjoy the resource and feel free to leave a comment. Thank you.
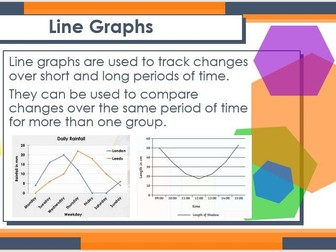
Lesson 1 - Reading and Interpreting Line Graphs
Lesson 2 - Draw Line Graphs
Understand how to read line graphs and interpret the information from them. Then, leading on from this, understanding how to apply this information to drawing their own line graphs.
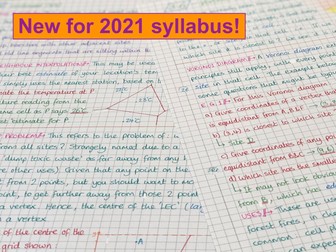
Handwritten notes on the new syllabus for IBDP Maths for 2021 - Applications and Interpretations SL (A&I SL). It is 52 pages - 8 on Algebra, 10 on Functions, 8 on Trig, 17 on Statistics, 9 on Calculus.
Each topic is carefully organised, with the subtopic numbers very clearly marked on each page, related to the exact numbers given in the official syllabus document.
The first topic is available for free here, if you want to give it a preview before buying the whole thing.
I have also finished the A&A SL & HL notes as well.
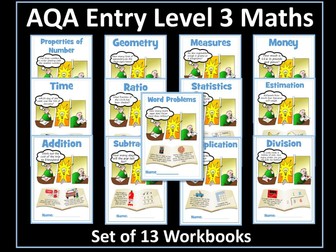
These resources have been designed for students working towards the AQA Entry Level Certificate in Maths who are working at Entry Level 3. The bundle contains 13, highly visual and age-appropriate workbooks / worksheets with answers, study notes, progress checks and certificates of achievement. The workbooks cover the entire specification and all the components:
Properties of Numbers
Addition
Subtraction
Multiplication
Division
Mixed Operation Word Problems
Estimation
Ratio
Money
Time
Measure
Geometry
Statistics
If you buy this resource and are pleased with your purchase, I would be extremely grateful if you could leave a review. As a token of appreciation, you can have a free resource of your choice up to the same value as your purchased resource. Just email inspireandeducate@aol.co.uk with your user name, the resource you have reviewed and the resource you would like for free.
You may also be interested in:
AQA Entry Level 2 Maths Bundle
Properties of Numbers
Addition
Subtraction
Ratio/Fractions
Money
Time
Measure
Geometry/Shape
Statistics
AQA Entry Level 1 Maths Bundle
Properties of Numbers
Addition
Subtraction
Ratio - Fractions - Halves
Money
Time
Length
Weight
Volume and Capacity
Geometry
Statistics
More Entry Level Maths Resources
Entry Level English Resources
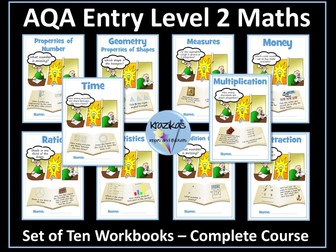
These resources have been designed for students working towards the AQA Entry Level Certificate in Maths who are working at Entry Level 2. The bundle contains 10 highly visual and age-appropriate workbooks with answers, study notes, progress checks and certificates of achievement. The workbooks cover the entire specification and all the components:
Properties of Numbers
Addition
Subtraction
Multiplication
Fractions
Money
Time
Measure
Geometry/Shape
Statistics
If you buy this resource and are pleased with your purchase, I would be extremely grateful if you could leave a review. As a token of appreciation, you can have a free resource of your choice up to the same value as your purchased resource. Just email inspireandeducate@aol.co.uk with your user name, the resource you have reviewed and the resource you would like for free.
You may also be interested in:
AQA Entry Level 3 Maths Bundle
The bundle contains 13 workbooks that cover all the components of Entry Level 2.
Properties of Numbers
Addition
Subtraction
Multiplication
Division
Mixed Operation Word Problems
Estimation
Ratio
Money
Time
Measure
Geometry
Statistics
AQA Entry Level 1 Maths Bundle
The bundle contains 11 workbooks that cover the entire specification of Entry Level 1.
Properties of Numbers
Addition
Subtraction
Ratio - Fractions - Halves
Money
Time
Length
Weight
Volume and Capacity
Geometry
Statistics
AQA Entry Level 1 Maths 11 PowerPoint Lesons and 11 Workbooks Bundle
More Entry Level Maths Resources
Entry Level English Resources
Please note the PNG files are photos that have been used for the previews only. They are not the documents needed to use the resource, they only photos of what is included.
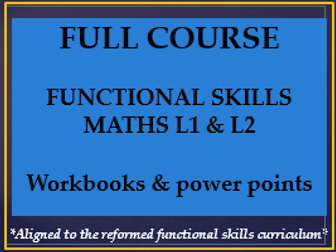
This bundle includes all the topics needed to teach functional skills. All topics for the reformed functional skills qualifications that are included have work books many differentiated to L1 & L2 . Lots of power points and the majority of answers are also included. This really is a bargain.
My exam board is city and guilds. But this would be useful for all exam boards.
Every work book Included is made for the reformed functional skills maths and include calculator and non calculator methods.
Place Value
Rounding and estimation
Multiply by 10,100,1000 and add and subtract including decimals.
Multiplication including decimals
Bidmas
Percentages of amounts, increase and decrease, reverse percentages and compound interest.
Fractions of amounts, simplify fractions mixed fractions, add and subtract fractions.
converting between fractions,decimals and percentages
Ratio and proportion
Averages
Probability
Graphs and charts
Area and perimeter including problems
Substitution into formula
Angles, symmetry and bearing,compass points and coordinates
Metric and imperial conversions
Scale plans, maps, nets ad elevations
L1 non calculator work book
L2 revision workbook with calculator and non calculator questions on every topic.
Please note if you do find typos the workbooks are in word so you can easily amend. I am going through and fixing them as I find them or they are reported to me.
Please see my resources (jonesk5) for the following available for free:
Division workbook
Course outline
Non calculator revision mock
time and timetables
21 x Y6 SAT Revision PowerPoints
They have a range of KS2 reasoning and arithmetic questions that are based around topics that are likely to appear in this years KS2 SAT. Ideal for short revision sessions or quick 20 minute starters to maths sessions.
These PowerPoints form full lessons of work that together cover the new A level Maths course for all exam boards. Together all the PowerPoints include;
• A complete set of notes for students
• Model examples
• Probing questions to test understanding
• Class questions including answers
• Individual whiteboard work
• Links to exercises in ‘The Textbook by CGP’ these can easily be edited for your textbook
The PowerPoints can be used in the lesson and also given to students that have missed a lesson
I have added ‘AS level maths 13 – Circles’ for free download
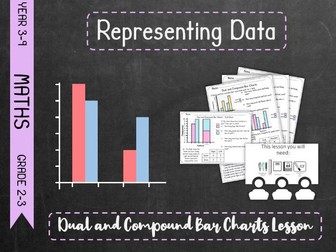
This lesson focuses on reading and drawing dual/comparative and compound/composite bar charts.
This resource consists of differentiated lessons, worksheets and print offs.
The lessons are a set of 3 differentiations of the same lesson in PowerPoints form as well as a mixed version to allow you to differentiate on the fly.
The worksheets are a set of 3 differentiations with some overlap in both PDF and PowerPoint form for easy editting. There is also an undifferentiated exit card for assessment purposes. This is a PDF.
Finally there is a variety of print offs that can be used as lesson aids. This includes blank and labelled axes for a variety of questions in the lesson.
Please read the preview before purchasing to see if this lesson is appropriate for you.
This lesson is based on the Pearson Key Stage 3 Maths Progress scheme of work but is appropriate the curriculum over.
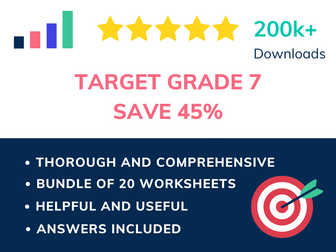
A collection of 20 well thought out GCSE maths worksheets with answers carefully designed to help students aiming for grade 7.
Thorough, comprehensive and structured to increase in difficulty gradually, beginning with scaffolded intro examples and building up to challenging extension questions that really get them thinking.
Bundle includes:
Algebraic fractions
Area of a triangle using trigonometry
Calculating with bounds
Composite fractions
Direct and inverse proportion
Enlargement (area and volume)
Evaluating fractional indices
Exponential growth and decay
Quadratic equations where a>1
Histograms
Inequalities on graphs
Inverse functions
Perpendicular lines
Quadratic formula
Rationalising the denominator
Rearranging formulas (factorising needed)
Sine and cosine rules
Surds
Transformations of graphs
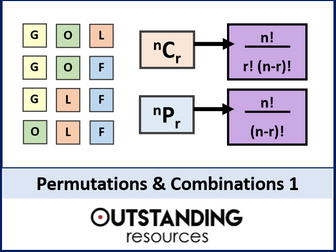
This is a whole lesson introducing the topic of Combinations and Permutations. The lesson focuses on understanding the difference, when to use them and how to use the formulas. This lesson is ready to go, with no prep required. It is also great for home learning. 27 slide presentation + additional resources.
It comes with:
a starter (getting pupils to think about the topic)
lesson objectives (differentiated)
key words
very clear teaching slides
excellent examples
MWB activities (for AFL)
Worksheet (with answers)
handout - to support students and great for student notes
a Plenary
ALL LESSONS on Statistics in one MEGA BIG Bundle:
Statistics: ALL Lessons + All Resources
LASTLY:
This lesson is flat packed for copyright purposes
Please provide a RATING with written feedback
Please email outstandingresourceshelp@gmail.com if there are any issues.
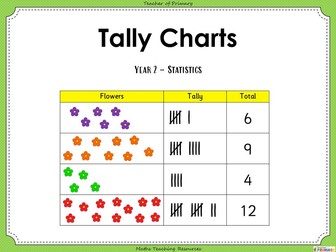
Tally Charts - Year 2
In this Year 2 statistics teaching resource, pupils will learn how to interpret and construct simple tally charts as per the curriculum objectives of the maths Year 2 Programme of Study - Statistics. Content includes:
1. PowerPoint teaching presentation
2. Activities to support the teaching of this objective with 2 accompanying worksheets
3. Three further differentiated worksheets with answers
‘Tally Charts - Year 2’ can be edited allowing teachers to adapt the resource if needed to suit each class they teach.
This was delivered to a low ability year 10 class. It is quite basic and missing some of the more complicated concepts dealing with Venn diagrams.
This is a PowerPoint intent on explaining how to fill a Venn Diagram with examples. I tried to include the important things to include when completing a Venn diagram. There are some generic questions contained within the slides.
Slides 1-7 were seen on lesson 1 and then I gave the class examples of this type.
Slides 8-18 were seen in lesson 2 (after recapping the previous slides) and further examples of this type were given to the class.
Any feedback would be greatly appreciated as this is my first resource I have uploaded.
A PowerPoint presentation to introduce the concept of Venn diagrams to year 7 pupils. Starts with classifying numbers and then moves onto extracting information from a diagram. No notation used - I would do that in the next lesson.
Free preview - This well thought out worksheet has been structured to increase in difficulty gradually, beginning with scaffolded intro examples and building up to more challenging questions that get them thinking.
Under the hood
Describing correlation and drawing lines of best fit
Using the line of best fit to estimate values (interpolation and extrapolation)
Outliers
Important: This is a free preview file. The full HQ sheet with answers included can be found here on TES by clicking the link below.
https://www.tes.com/teaching-resource/resource-12829820
Thorough, comprehensive, and suitable for both KS3 and KS4. Our resources are carefully designed to boost confidence and grades.
 Quick View