Understanding Trade is a Geography unit suitable for upper KS2 (Y5-6) and is a great way to teach students about global trade.
The planning overview, topic title page and vocabulary page can be downloaded for free here. Lessons include:
L1 – Investigating where the products we buy come from
L2 – Understanding that all products have a supply chain
L3 – Exploring the chocolate supply chain
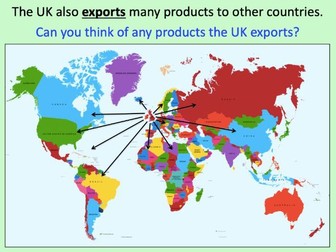
L4 – Investigating the UK’s biggest exports
L5 – Investigating the highest value exports of different countries
L6 – Is the banana trade fair? (FREE)
Each lesson includes a presentation and differentiated activities/worksheets.
If you like this resource, we would appreciate a review! We will happily send you a free resource in return for a review or useful suggestions/feedback. Contact us at ed@teachitforward.co.uk.
This lesson is part of Understanding Trade, a Geography unit designed for students in upper KS2 (Y5-6).
The presentation starts by recapping what imports and exports are. It goes on to look at the UK’s top ten exports – mainly manufactured products – and the human and physical factors which help UK exports in this area.
In the activity, students use Microsoft PowerPoint to create a table of the UK’s top ten exports. They then use an online chart maker to produce either a pie chart or bar graph to illustrate this data. It is differentiated three ways:
Easier – Students use step-by-step instructions with some data already filled in
Medium – Students use step-by-step instructions
Harder – Minimal instructions – IT experts only!
If you like this resource, we would appreciate a review! We will happily send you a free resource in return for a review or useful suggestions/feedback. Contact us at ed@teachitforward.co.uk.
If you want a preview, try the first (SL) topic of the new course for free
Handwritten notes on the recently changed syllabus for IBDP Maths for first exams in 2021 - this is the Applications and Interpretation HL course (A&I HL / AIHL).
It is 112 pages long - 19 on Algebra, 16 on Functions, 26 on Trig/Geometry, 28 on Stats/Probability, 23 on Calculus. So it is far more concise than the ~1000 pages of an HL textbook. It is split into 5 topics, which all have the SL content within them as a subset. There will also be significant overlap with the Analysis & Approaches course. This is the final course of the four that we have in this shop, finished in time for the 2023 May exams. It contains many concepts not touched by the old core courses at all, like graph theory, voronoi diagrams, matrices, phase portraits, etc.
TOPICS:
1 - Algebra
2 - Functions
3 - Trigonometry and Geometry
4 - Statistics and Probability
5 - Calculus
Please ‘follow’ my shop, so you will be notified when other notes become available in the future. Please let me know if you have any feedback or improvements that could be made.
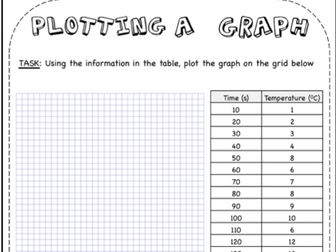
This resource is a lesson workbook with questions on:
Graph plotting
Spotting anomalies in graphs and tables
Calculating the mean of a data set
Key definitions (including variables, accuracy, precision etc)
Drawing lines of best fit
There is a full answer set for every page of the workbook. The workbook is designed to test how data is manipulated and displayed with an emphasis on spotting trends in data.
Exploring Brazil is a Geography unit designed for students in KS2 (Y4-6).
The planning overview, topic title page and vocabulary page can be downloaded for free here. Lessons include:
L1 – Identifying the countries and capitals of South America
L2 – Writing a Brazil fact file
L3 – Using 4 and 6-figure grid references to locate Brazilian cities
L4 – Identifying the human and physical features of Brazil
L5 – Exploring Brazil’s ecosystems
L6 – Investigating Brazil’s weather and climate
Each lesson includes a presentation and differentiated activities/worksheets.
If you like this resource, we would appreciate a review! We will happily send you a free resource in return for a review or useful suggestions/feedback. Contact us at ed@teachitforward.co.uk.
Hi there!
This is another lesson that should last around 30/40 minutes and is a maths lesson based around word problems; working out which operation to perform and when it is appropriate.
I used this as an interview lesson!
*Includes*
Lesson Plan
Learning Support sheet for TA deployment
Lesson starter activity and resources
Tables labels (great for interview lesson)
Main lesson worksheet
Worksheet answersheet for teacher
Extra word problems for starter or plenary
Presentation for Input
Happy teaching!
Miss Austin
This lesson is part of Exploring Brazil, a Geography unit designed for students in KS2 (Y4-6), but can also be taught as a stand alone lesson.
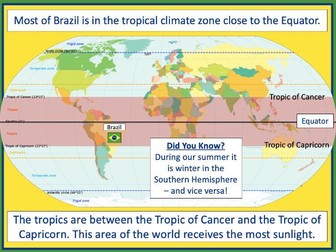
The presentation first locates Brazil in the world’s climate zones and asks children to infer what the country’s weather and climate might be like.
Next, students look at three areas of Brazil in more detail – Manaus in the Amazon, Teresina in the caatinga desert region and Porto Alegre in the south of the country – and investigate a climate graph.
There are two activities:
Activity 1:
Students first investigate three climate graphs, looking at temperature and rainfall. Their challenge is to match each graph to an area of Brazil, explaining their reasoning for their choices. It is differentiated 2 ways:
Easier – Students match two statements to each climate graph, then match each graph to one of the three cities/regions.
Harder – Students write sentence describing the temperature and rainfall patterns in each climate graph, then match each graph to one of the three cities/regions.
Activity 2:
Students create their own Brazil climate graphs in Microsoft Excel using step-by-step instructions.
If you like this resource, we would appreciate a review! We will happily send you a free resource in return for a review or useful suggestions/feedback. Contact us at ed@teachitforward.co.uk.
A fantastic Maths Challenge! ANSWERS provided!
Learning Intention: To investigate time zones and to calculate flight times.
Activity: Students have to calculate the arrival time (UK and local time at destination) for each flight.
For the highest achieving students, they have to use the 2 websites provided to calculate flight times and time zone differences as well as generating their own flights!
Almost every parent commented on how exciting and challenging this homework challenge was and the students loved it!
PDF and Word formats available so fully editable.
Please note: Depending on the time of year, the flight times on the activity sheets may vary by 1 HOUR. This is because of daylight saving times (when the UK clocks move forwards/backwards by 1 hour ). You don’t need to worry about this, just use the times written on the activity.
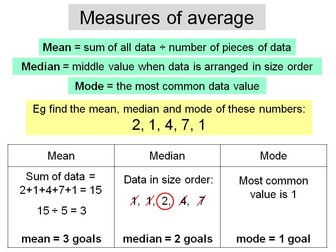
A complete lesson for introducing mean, median and mode for a list of data.
Activities included:
Mini whiteboard questions to check pupil understanding of the basic methods.
A worksheet of straight forward questions.
Mini whiteboard questions with a progression in difficulty, to build up the skills required to do some problem solving...
A worksheet of more challenging questions, where pupils are given some of the averages of a set of data, and they have to work out what the raw data is.
Some final questions to stimulate discussion about the relative merits of each average.
Printable worksheets and answers included.
Please review it if you buy as any feedback is appreciated!
The task is designed to be an open lesson were students have freedom to choose where they want to go from the destinations. Both if you have time. It is a chance for students to discuss the fundamentals of booking a holiday as well as incorporating maths. Students will feel like they have achieved something even if they do not finish the whole task as each smaller task is designed individually and only impacting the final holiday cost at the end. Tasks included:
TASK AND MATHS TOPIC
Flights and Accommodation- Reading from a table
Vouchers- Percentages
Weather- Mean and Range from bar charts
Luggage and Weather conversion- Function Machines
New York Day trip- Time Planning
Florida Day trip- Route Planning
Filling in booking form- General Number. (Adding/Dividing/Multiplying)
SUITABLE FOR high school lower and higher maths ability. functionals skills.
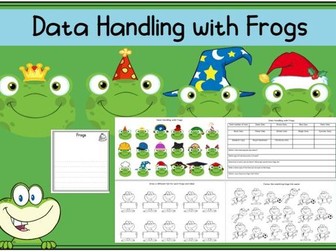
Fun with frogs and data handling at KS1.
The lesson starts with children looking at the colour poster of 18 frogs all wearing different hats.
Children observe carefully looking at the frogs eye colour and types of head wear.
Sheet 2 asks children to count and record e.g. number of frogs with brown eyes/party hats/work hats.
There are 5 questions to answer.
Sheet 3 is for children to draw a hat on each of the frogs and label them.
Sheet 4 shows frogs in different positions or activities. Children colour the matching frogs to make them the same.
Sheet 5 shows 2 writing frames for children to write about frogs or their findings of the data handling activities.
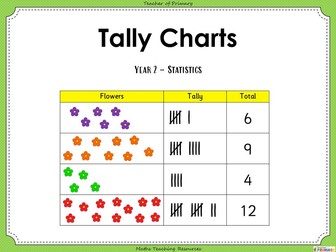
Tally Charts - Year 2
In this Year 2 statistics teaching resource, pupils will learn how to interpret and construct simple tally charts as per the curriculum objectives of the maths Year 2 Programme of Study - Statistics. Content includes:
1. PowerPoint teaching presentation
2. Activities to support the teaching of this objective with 2 accompanying worksheets
3. Three further differentiated worksheets with answers
‘Tally Charts - Year 2’ can be edited allowing teachers to adapt the resource if needed to suit each class they teach.
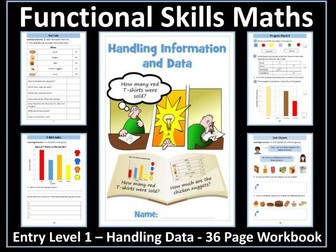
This resource has been designed for students working towards Functional Skills Maths qualifications at Entry Level 1. It contains an age-appropriate,36-page workbook on handling information and data - Outcomes 11,12,13.
The 35-page workbook contains 10 information pages, 24 worksheets (with answers), 2 progress checks and a certificate of achievement. The workbook will help pupils to achieve these outcomes:
read numerical information from lists
sort and classify objects using a single criterion
read and draw simple charts and diagrams including a tally chart, block
diagram/graph
The resource is provided in PDF format and an editable PowerPoint version to enable personalistion of the resource. It can be used for classwork, homework, revision or as an independent learning pack.
Please note, the watermark on the preview images is not present on the resource itself.
If you buy this resource and are pleased with your purchase, I would be extremely grateful if you could leave a review. As a token of appreciation, you can have a free resource of your choice up to the same value as your purchased resource. Just email inspireandeducate@aol.co.uk with your user name, the resource you have reviewed and the resource you would like for free.
You may also be interested in:
Entry Level 1 - Handling Data - 100+ Slide PowerPoint Lesson
The PowerPoint clearly explains how to read numerical information from lists,
sort and classify objects using a single criterion, read and draw simple charts and diagrams including a tally chart and block graph.The PowerPoint provides many opportunities for pupils to identify data from lists, tally charts and block graphs. It is ideal for introducing the handling data component of the specification and for revision purposes.
Save money and buy both resources at a discounted rate:
Entry Level 1 - PowerPoint Lesson and Workbook
Functional Skills Maths - Entry Level 1 Bundle
This bundle contains 10 workbooks and 10 PowerPoint lessons that cover the entire specification for Entry Level 1.
Functional Skills Maths - Entry Level 2 Bundle
This bundle contains 13 workbooks and 13 PowerPoint lessons that cover the entire specification for Entry Level 2.
Functional Skills Maths - Entry Level 3 Bundle
This bundle contains 16 workbooks and 16 PowerPoint lessons that cover the entire specification for Functional Skills Maths at Entry Level 3.
In this lesson, students will learn to interpret and contruct pie charts. They will first learn how pie charts are used and how they can be used to solve problems. They will then complete a range of questions which require them to reason and problem solve with pie charts.
3 differentiated worksheets provided with answers.
Duration: 1 hour
Leave a review for this resource and send a copy of your receipt to resourcesforyou100@outlook.com to receieve a FREE single resource of your choice!
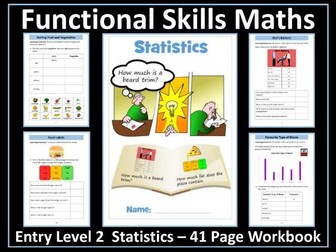
This resource has been designed for students working towards Functional Skills Maths qualifications at Entry Level 2 (Edexcel-Pearson, NCFE, City and Guilds and Open Awards). It contains an age-appropriate, 41-page workbook on statistics (outcomes 22, 23, 24, 25).
The workbook contains 11 information/explanation sheets, 26 worksheets (with answers), 3 progress checks and a certificate of achievement. The workbook will help pupils to achieve these outcomes:
Extract information from lists, tables, diagrams and bar charts
Make numerical comparisons from bar charts
Sort and classify objects using two criteria
Take information from one format and represent the information in another
format including use of bar charts
The resource is provided in PDF format and an editable PowerPoint version to enable personalisation of the resource. It can be used for classwork, homework, revision or as an independent learning pack.
Please note, the watermark on the preview images is not present on the resource itself.
If you buy this resource and are pleased with your purchase, I would be very grateful if you could leave a review. As a token of appreciation, you can have a free resource of your choice up to the same value as your purchased resource. Just email inspireandeducate@aol.co.uk with your user name, the resource you have reviewed and the resource you would like for free.
You may also be interested in:
Entry Level 2 - Statistics - 120 Slide PowerPoint Lesson
This editable, 120-slide PowerPoint lesson provides many opportunities for pupils to practice the skills outlined in the learning outcomes. It is ideal for introducing the statistics component of the Entry Level 2 specification and for revision purposes.
Save money and buy both resources at a discounted rate:
Functional Skills Maths - Entry Level 2 - Statistics PowerPoint Lesson and Workbook
Functional Skills Maths - Entry Level 2 Bundle
This bundle contains 13 workbooks and 13 PowerPoint lessons that cover the entire specification for Functional Skills Maths at Entry Level 2.
Functional Skills Maths - Entry Level 1 Bundle
This bundle contains 10 workbooks and 10 PowerPoint lessons that cover the whole of the Entry Level 1 specification.
More Entry Level Functional Skills Maths Resources
Entry Level English Resources
Maths Homework Booklet targeted for KS3 Maths Students. I have split it up into three stages with increasing difficulty so packs can be distributed to students accordingly and so that it will provide a challenge for all. At least a terms worth of homework is contained here. (add it to the other 2 packs & would make up a year )
This maths pack covers; multiplying & dividing fractions, percentage change, compound interest, simple interest, bearings, theoretical probability, experimental probability, averages, pie charts, area & volume, ratio & proportion, properties of numbers, HCF, LCM, significant figures and more.
Please check out the other stages too if you find this useful which cover other topics.
All funds raised by the sale of this resource will be donated to the NSPCC.
P.s. Answers are at the back to you may want to remove before distributing!
This was delivered to a low ability year 10 class. It is quite basic and missing some of the more complicated concepts dealing with Venn diagrams.
This is a PowerPoint intent on explaining how to fill a Venn Diagram with examples. I tried to include the important things to include when completing a Venn diagram. There are some generic questions contained within the slides.
Slides 1-7 were seen on lesson 1 and then I gave the class examples of this type.
Slides 8-18 were seen in lesson 2 (after recapping the previous slides) and further examples of this type were given to the class.
Any feedback would be greatly appreciated as this is my first resource I have uploaded.
A 20 question test on ‘Statistics’ in Foundation GCSE Maths, comprising: 10 questions on procedural calculations; 5 questions on reasoning and communicating mathematically; and 5 problem solving questions. This resource is ideal for either formative or summative assessment and can be used in lesson time as a half term assessment, a homework or for revision.
The topics covered correspond to the first two columns of subject content from section 1 of the OCR GCSE (9-1) Mathematics specification J560.
12.01 - Sampling: Populations and samples
12.02 - Interpreting and representing data: Categorical and numerical data
12.03 - Analysing data: Summary statistics; Misrepresenting data; Bivariate data; Outliers
Further details and other resource ideas can be found by visiting Teach Cambridge.