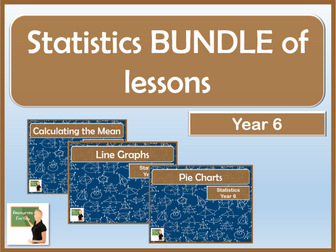
This clear, detailed and visually-appealing resource offers a complete reference point for Year 6 teachers, parents and children when covering ‘Statistics’ in mathematics.
The content is organised into the following sections:
-Overview: Learning areas covered, key definitions, why this learning is important;
-Tables and Timetables;
-Line Graphs;
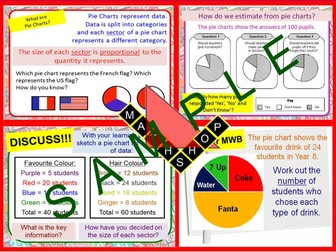
-Pie Charts;
-The Mean Average;
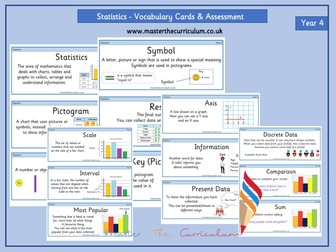
-Key Vocabulary.
The resource is designed to be printed onto either A3 or A4, and is provided as both a PDF and a Word version (so that you can edit if you want to). All images used are licensed for commercial use and are cited on a separate document (included).
The lessons in this BUNDLE teach students how to:
interpret and construct line graphs and use these to solve problems.
-calculate and interpret the mean as an average
-interpret and construct pie charts and use these to solve problems
All lessons come with an engaging powerpoint presentation and differentiated activity sheets.
These lessons are aimed at Year 6 students but can easily be modified to suit Year 5 and KS3 students.
Hi folks, time to upload and share a few more lessons from a decade ago (probably antiquated now) and this stems from some of the interactions with newbies on Twitter currently. Firstly I just wanted to say thanks to TES and all those who are sharing their fantastic resources. All I have done is utilised some of these resources and made a flipchart with a humble contribution from myself. Some of you will recognise parts of your resources embedded in the flip. I have TEEPED majority of the lessons as well. These lessons may perhaps be suitable for KS2 (hopefully) and KS3 . Please feel free to ameliorate it further.
Within this document you will find a mild (single chilli), hot, spicy and extra spicy challenge. This is for teaching statistics to year four (but can be adapted). I have used some mastery level challenges within also.
This is a COMPLETE resource pack (up to 10 lessons) for teaching all Year 4 Statistics objectives. Included is differentiated worksheets (28 pages) to teach tables, bar charts, time graphs, pictograms and other graphical representations of data (in Word and PDF format - the Word versions can of course be edited if necessary) and answer sheets. In addition there is a 50 page flipchart (ActivInspire, PowerPoint and PDF format) to help deliver and teach the lessons. Also included is a planning tool, so you’ll simply need to copy and paste plans into your desired format. Statistics resources are hard to find, especially differentiated, with flipcharts and planning, and this resource will save you the many hours/days of planning, resourcing etc.
Objectives covered:
Interpret and present discrete and continuous data using appropriate graphical methods, including bar charts and time graphs
Solve comparison, sum and difference problems using information presented in bar charts, pictograms, tables and other graphs
Check out my Year 4 Assessments for these objectives
https://www.tes.com/teaching-resource/year-4-statistics-assessments-11080947
Check out my shop to find lots of other fantastic maths resources!
Visit My Shop!
More like this…
Year 4 Maths and Science Assessments
42 Year 4 Maths Mini-Assessments
Adding & Subtracting Fractions
Year 4 Symmetry
Equivalent Fractions
Short lesson support based on statistics. Lessons suitable for entry 1-3 learners. Powerpoints are support for lessons and not actual lessons. These can be interpreted however the individual using them sees fit.
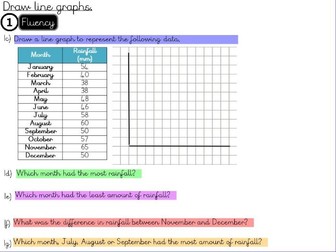
This is a whole lesson based on the Year 5 Statistics objective of " Draw line graphs”. This resource includes the teacher input ( learning journey), independent worksheet and a depth activity to deepen the children’s understanding of the concept being learned.
The questions have been inspired and adapted from the White Rose Small Steps Guidance and Teaching for Mastery documents. This document is useful for teachers who have adapted Maths Mastery and need guidance in the approach or those who are looking for variation in fluency, reasoning and problem solving or simply those who don’t want to plan it themselves but want high quality resources and quality first teaching. =)
All of the documents that are uploaded as an Activinspire file are interactive and all of the concrete/pictorial manipulative can be used, moved and manipulated.
This document can be downloaded on Activinspire and it is also available as a PDF for those who do not have Activinspire.
Please note - these resources are not compatible with Smart Notebook and the PDF file is not interactive.
Thank you for taking the time to review my resources. =)
I hope this helps you with your teaching and if it does please could you be kind enough to leave some positive feedback. =)
Kind regards,
@MasteryMaths01
Year 2 statistic assessment covering:
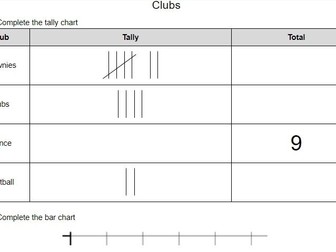
• Identifying block graphs, tally charts and pictograms
• Constructing block graphs, tally charts and pictograms
• Answering questions on block graphs, tally charts and pictograms
• Asking questions on block graphs, tally charts and pictograms
For this assessment the score is out of 16 and is a great way to track where your children are and see what if any invention the children need to help them become more secure with statistics.
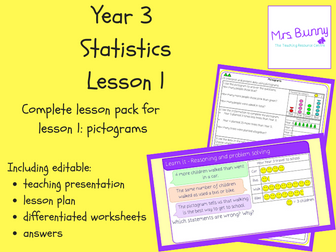
This ready-to-use, top quality set of resources allows teachers to easily teach the Year 3 Maths topic of pictograms to a mixed ability class.
This lesson links well with White Rose Maths – Statistics. It forms part of a series of lessons on money which include coverage of the objectives:
• Interpret and present data using bar charts, pictograms and tables
• Solve one-step and two-step questions using information presented in scaled bar charts and pictograms and tables.
The editable teaching presentation effectively models concepts to children and is accompanied by a lesson plan and differentiated worksheets (with answers) – catering for the needs of most Year 3 children.
The worksheets and lesson plan are both editable, giving you the option to make any changes you feel necessary with the knowledge you have about your class and school setting.
Check out my free resources to get a taste for the quality of lessons available.
#Y3 #Statistics #Y3S #LKS2 #Maths
Limited time only this special price for over £30 pounds worth of resources a SPECIAL PRICE.
The Great ALL Statistics Bundle filled with worksheets and answers, lesson presentation engaging and interactive.
Great for whole lesson or quick fire revision.
11 Resources, Over 15 Lessons worth of resources.
Contains GREAT Animated Graphics / tools to make that teaching easier. Ideal for revision or for whole lessons, very well planned and in detail so ideal for either mode.
Data Handling Lessons. Enjoy!
Ideal for GCSE 9-1 exam practice
Ideal for GCSE revision
A range of statistics around a Roman theme. Contains statistics on population and area data during the Roman Republic and Empire. Can be used for maths or computing activities.
Statistics have been collected from a range of sources: there may be some inaccuracies due to the long time scales.
A guide to why we use statistics when collecting fieldwork data. It runs through the main tests and why we choose each one relating to the data which has been collected.
Engage your students with this comprehensive fill-in-the-blanks exercise designed to demystify the world of statistics.
Perfect for math classes or homeschooling, this resource provides an interactive way for students to grasp key statistical concepts: mean, mode, median, and range.
Whether used as an in-class activity or for independent study, this fill-in-the-blanks exercise will make statistics both understandable and enjoyable!
Content:
6 Fill-in the blanks worksheets
Subject: elementary statistics & its fundamental indicators
Format: PDF printable
Solutions:included
A quick end of unit assessment for statistics in Year 2.
It uses some data from previous SATS papers but with slightly different questions. Differentiated for all learners.
18 mixed resources allowing teacher’s to choose the most appropriate resources for their pupil’s needs and abilities.
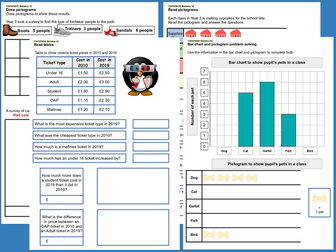
Read and Draw Pictograms A-C
Read and Draw Bar Charts A-F
Read Tables A-C
Bar Chart and Pictogram Problem Solving A-F