
This lesson is fantastic for cross-curriculum links between Maths and Geography.
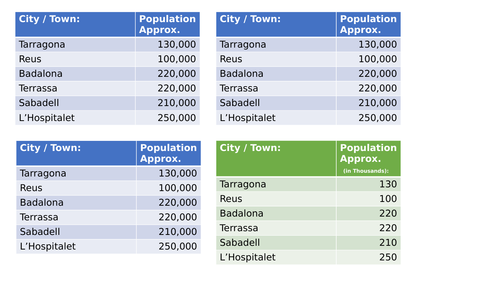
The children create bar charts using data about the population of some of the cities/towns in Catalonia.
*LO: To create a bar chart showing the population for towns/cities within Catalonia. *
Using the data (Population Approximately), the children will create a bar chart of the population using data for towns or cities within the province of Catalonia.
The children are given a partially labeled bar chart and they have to add the data and draw the bars.
The data has also been differentiated to increments of 100 (labelled as 100 thousand in the Y axis).
Something went wrong, please try again later.
This resource hasn't been reviewed yet
To ensure quality for our reviews, only customers who have downloaded this resource can review it
Report this resourceto let us know if it violates our terms and conditions.
Our customer service team will review your report and will be in touch.
£0.00