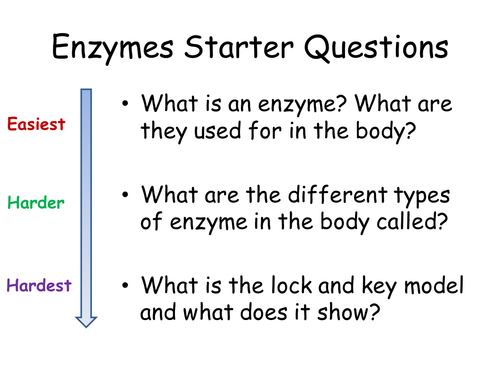
This fits into the Y8 Food and Digestion topic but can be used for assessing tables of results drawing and graph plotting. Students are given information to be able to plot a graph which they then have to analyse. The table of results must be completed by identifying any anomalies and then calculating the mean average before a line graph is plotted. New style assessment levels are given.
Something went wrong, please try again later.
This resource hasn't been reviewed yet
To ensure quality for our reviews, only customers who have downloaded this resource can review it
Report this resourceto let us know if it violates our terms and conditions.
Our customer service team will review your report and will be in touch.
£0.00
