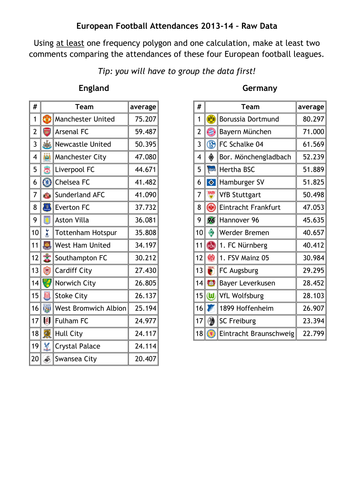
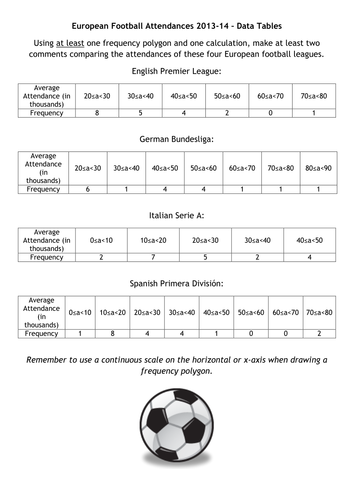

I really wanted some frequency polygon work but it is very thin on the ground, so I came up with this. I have also linked the website from which I got all the data. There are two versions; one (Raw Data) where they must tabulate first, and a second (Data Tables) for those you just want to get on with graphing and interpreting.
Something went wrong, please try again later.
Thank you for publishing your resource. It has been selected to be featured in <a href="https://www.tes.com/teaching-resources/collections/secondary-maths/"> a new secondary maths collection</a>.
An engaging task that gets students to draw frequency polygons for the attendance at various European football leagues. You can choose to give them the raw data to practise creating grouped frequency tables as well, or the author has also provided them already grouped. The task is left deliberately open for students, so they can choose which leagues to use, and what comparisons to make.
More than just plotting the frequency polygons. Thank you!
Useful data sets for comparing averages (grouped frequency) as well as for Frequency Polygons
Report this resourceto let us know if it violates our terms and conditions.
Our customer service team will review your report and will be in touch.
£0.00