

This is for pupils to develop the ability to use a spreadsheet (I wrote it in excel) to process a large amount of data in order to calculate a value for g (set to be a little lower than 9.8) and then lead into consideration of experimental errors.
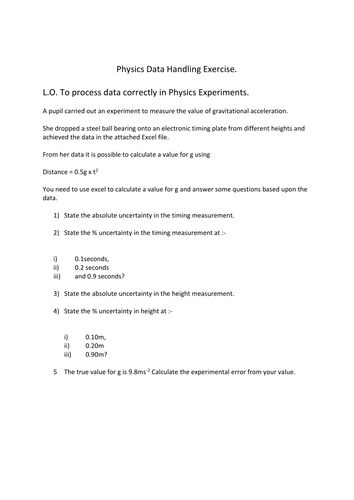
Using s=ut + 1/2at2 pupils can calculate gravitational acceleration.
Pupils are provided with values for s and t
Pupils need to calculate a mean t from a very large data set (easy to do using excel).
Pupils then need to square the mean t.
Then they need to plot s against t2 which will give them a linear graph with the gradient as 1/2 a.
The worksheet is editable so weaker pupils can have more guided instructions. Stronger pupils can work their way through.
The accompanying worksheet then looks at errors in measurement- absolute and % AND there is a random error in the data set.
Pupils can use absolute errors in the data to determine size of error bars,
Pupils can work out experimental error, plot best, steepest and shallowest trend lines for g and compare that against the total % error in their data.
Something went wrong, please try again later.
This resource hasn't been reviewed yet
To ensure quality for our reviews, only customers who have purchased this resource can review it
Report this resourceto let us know if it violates our terms and conditions.
Our customer service team will review your report and will be in touch.
£3.00