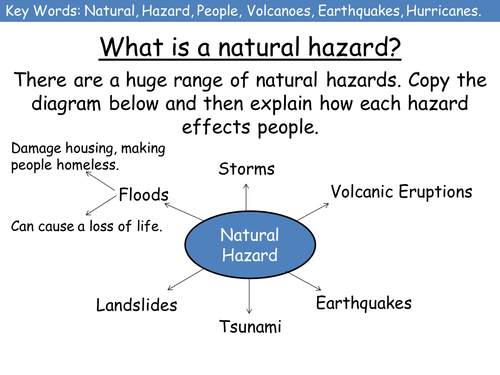

Make a copy the spider diagram and then explain how each hazard effects people.
Students write down the key idea and watch a video about the worst natural disasters, they can make further notes onto their spider diagram.
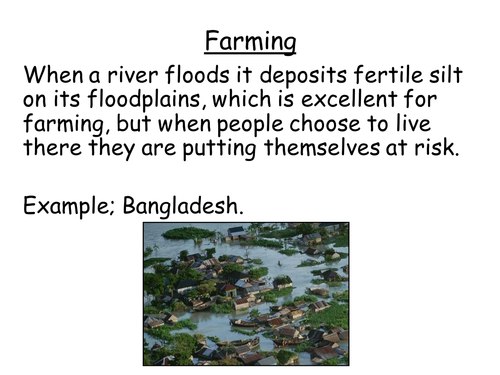
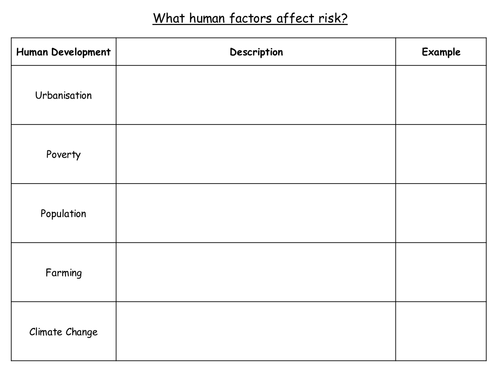
Students carousel around the room collecting the information about how factors increase the risk from natural hazards. Extension question: In the future, why is it likely that increasing numbers of people will be at risk from natural hazards?
Students to complete an exam question: Explain two human developments that would increase the risk of people being affected by natural hazards. (4) Mark scheme shown on the PowerPoint - if time allows get the students to peer mark each others answers.
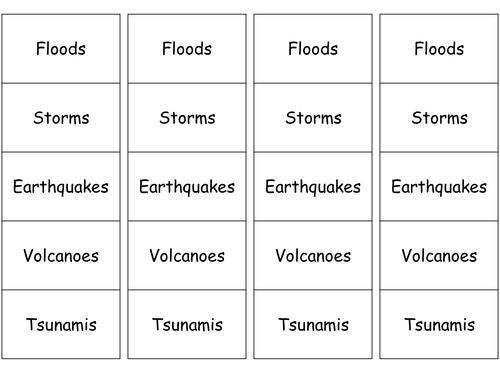
Students rank cards from the biggest impact to the smallest impact and explain why they have put the cards into that order.
Students write down the key idea and watch a video about the worst natural disasters, they can make further notes onto their spider diagram.
Students carousel around the room collecting the information about how factors increase the risk from natural hazards. Extension question: In the future, why is it likely that increasing numbers of people will be at risk from natural hazards?
Students to complete an exam question: Explain two human developments that would increase the risk of people being affected by natural hazards. (4) Mark scheme shown on the PowerPoint - if time allows get the students to peer mark each others answers.
Students rank cards from the biggest impact to the smallest impact and explain why they have put the cards into that order.
Something went wrong, please try again later.
This resource hasn't been reviewed yet
To ensure quality for our reviews, only customers who have purchased this resource can review it
Report this resourceto let us know if it violates our terms and conditions.
Our customer service team will review your report and will be in touch.
£3.00