
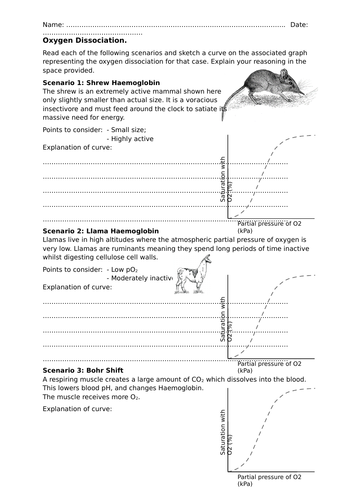
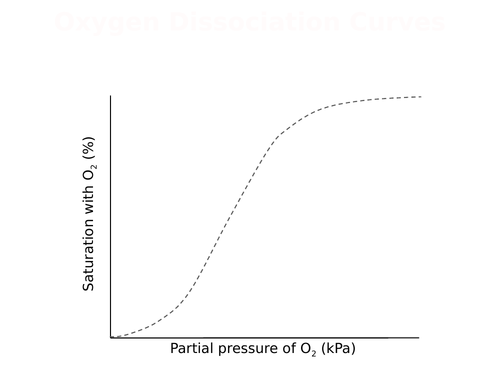
The resource consists of a double-sided worksheet comprising 6 examples of oxygen dissociation curves that may differ from a ‘standard’ curve for ‘normal’ haemoglobin for various reasons. Students need to read information on the situation in each case and predict, with detailed reasoning, the shape of the curve most likely for that case.
This serves as a useful consolidation activity and also encourages a re-examination of students’ understanding of dissociation curves so is equally a useful revision resource.
The accompanying mark scheme can be used for self/peer assessment and also to promote discussion in the classroom.
Something went wrong, please try again later.
Excellent, easy to understand diagrams, covering a whole range of important scenarios - fit's the spec well and doesn't miss any of the main points out. Could have included a past exam question too, where they ask students to read off of specific values of a graph.
Report this resourceto let us know if it violates our terms and conditions.
Our customer service team will review your report and will be in touch.
£3.00