


Enter each pupil’s details - name, gender, PPG and SEN status as well as their KS1 and KS2 SATs outcomes and this spreadsheet automatically calculates:
- The prior attainment group (PAG) group for each child
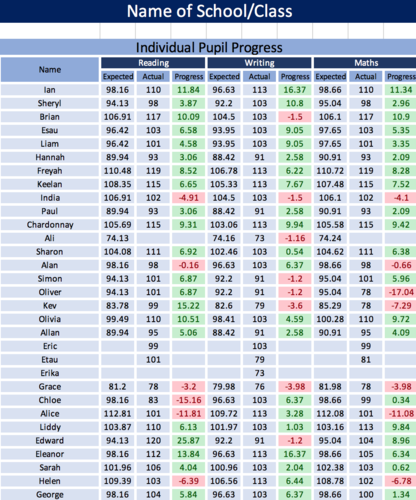
- individual, class and group pupil progress and attainment
- calculates children’s attainment and progress based on their cohort, gender, PPG and SEN status
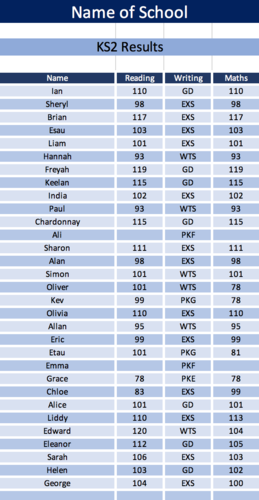
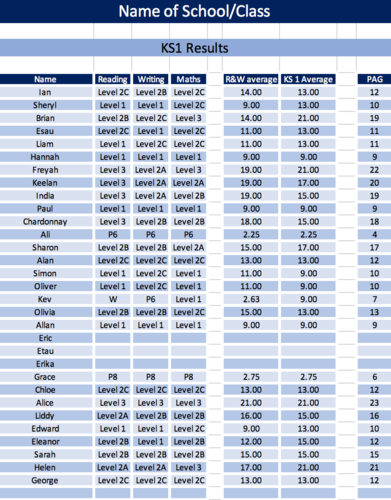
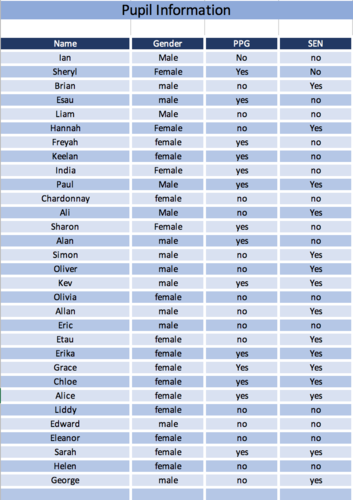
See pictures for how the data is shown.
what to do:
- enter each child’s name, gender, PPG and SEn status to the pupil info tab only
- Enter KS1 results (includes P levels)
- Enter KS2 results scaled scores for maths and reading. For writing the following codes are accepted - GD, EXS, WTS, PKG, PKE, PKF, BLW, P8, P7, P6, P5, P4, P3ii, P3i, P2ii, P2i ,P1ii, P1i
From here the spreadsheet does the rest
- Calculates the PAG for each child and from this, sets the targets in reading, writing and maths for each child, based on a R&W average and then a KS1 average - see attached DfE document for further guidance
- Once the KS2 data is added, the spreadsheet calculates each child’s progress and this is reflected in a green or red formatting for easy reference
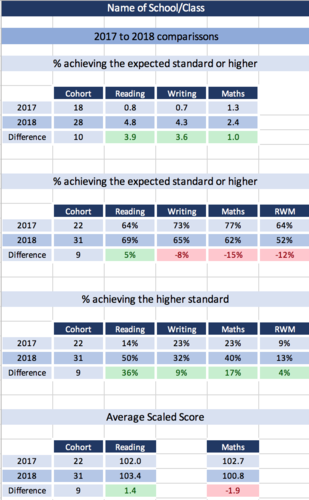
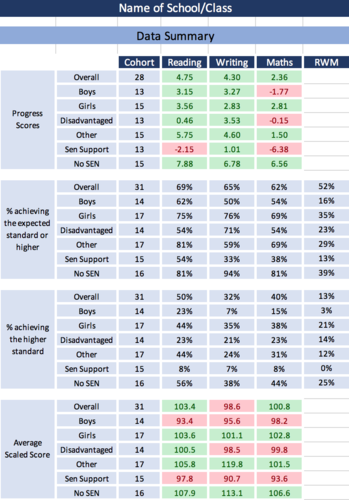
- On the summary tab, progress scores are calculated for the whole cohort, boys, girls, disadvantaged and other, SEN support and no SEN. The percentage achieving the standard or higher for each of these groups as well as the percentages achieving RWM for each category. This is mirrored for the percentage of children achieving the higher standard in for each group and RWM. Finally, the average scaled scores are calculated for overall and each group.
In addition, you can enter your 2017 data for easy comparison.
Each sheet fits neatly onto an A4 sheet for use by governors, SLT or school ‘visitors’
UPDATE**
if you purchased an earlier version please see the alterations below
My apologies – I sent out an earlier version of the spreadsheets to you. It affects the boy/girl, disadvantaged and SEN progress for reading and maths only. It is easy to fix
On the summary tab, click in cell D7. The formula reads
=IFERROR(((SUMIF(‘Pupil Info’!B:B,“male”,‘Ind Pupi Progress’!C:C))/COUNTIFS(‘Pupil Info’!B:B,“male”,‘Ind Pupi Progress’!C:C,">10")-100),"")
where it is C:C this should be D:D and the -100 needs deleting (keep the brackets though)
This needs repeating for cells D8-D12
In maths, it is similar
=IFERROR(((SUMIF(‘Pupil Info’!B:B,“male”,‘Ind Pupi Progress’!I:I))/COUNTIFS(‘Pupil Info’!B:B,“male”,‘Ind Pupi Progress’!I:I,">10")-100),"")
The I:I needs altering to J:J and delete the -100 again for cells F7 to F12
Something went wrong, please try again later.
This resource hasn't been reviewed yet
To ensure quality for our reviews, only customers who have purchased this resource can review it
Report this resourceto let us know if it violates our terms and conditions.
Our customer service team will review your report and will be in touch.
£3.00