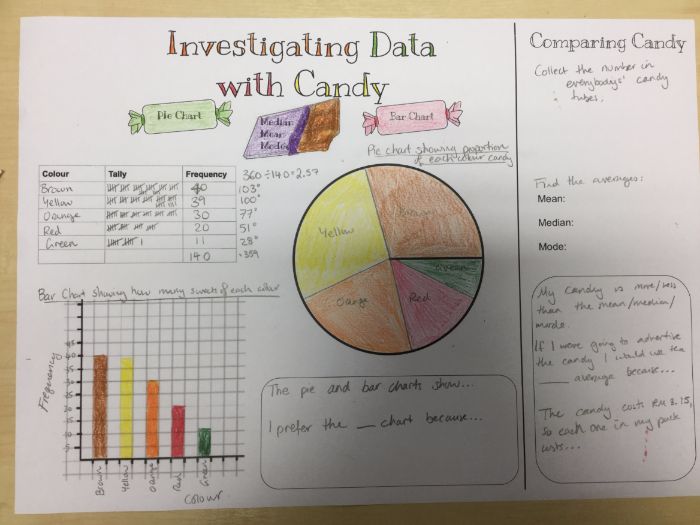
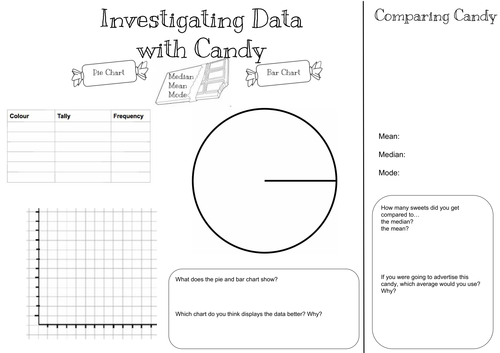
This is an activity that I have run with low end ability maths students. It consolidates understanding of data by asking them to draw a pie and bar chart as well as find the three averages. Learners need a small pack of multi-coloured sweets such as mini m&ms or smarties. They fill in a table of how many in each colour then turn this into charts. They also collect in the totals from everyone and calculate the average number of sweets. There's a few interpretation questions too.
Something went wrong, please try again later.
Report this resourceto let us know if it violates our terms and conditions.
Our customer service team will review your report and will be in touch.
£0.00