
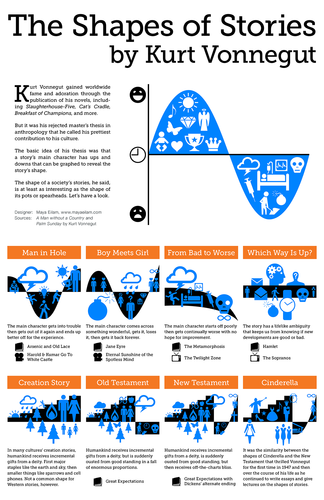


A lesson based on kurt vonneguts story graphs - pupils sequence a simple fairy tale then produce their own stoy graph of the key events like the ones shown in the infographic and on the powerpoint - they then learn a little about kurt vonnegut the author before comparing their story graphs with the persons next to them and looking for similarities and differences in the stories as a plenary. they can also identify the main story type
Something went wrong, please try again later.
This resource hasn't been reviewed yet
To ensure quality for our reviews, only customers who have downloaded this resource can review it
Report this resourceto let us know if it violates our terms and conditions.
Our customer service team will review your report and will be in touch.
£0.00