
LESSON COVERS:
Urbanisation, rates of urbanisation, push and pull factors, rural urban migration and natural increase. POSSIBLE DOUBLE LESSON
LESSON INVOLVES:
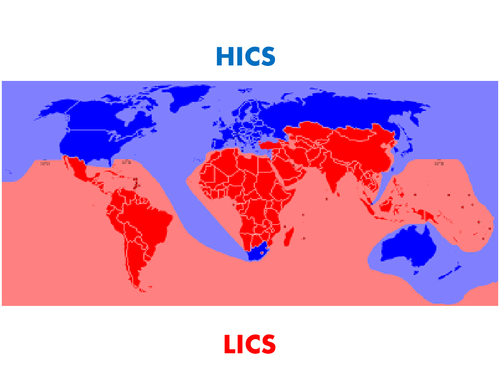
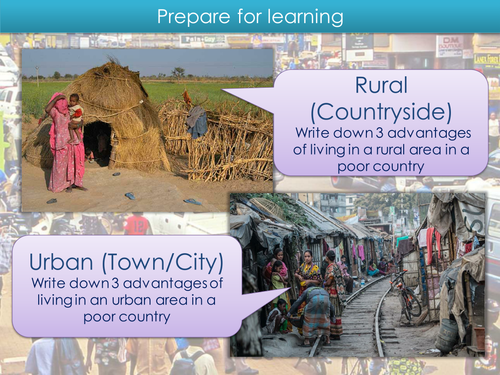
main features include key word activities exploring and applying the definition of HIC, LIC, NEE, Push and Pull factor. A timed activity where student have 90 seconds to view an image and decide if it is is a push or a pull factor and explain (it is slide 7 - once on the slide click to start the clock, it should go through each image automatically - you can remove the animations if you prefer). This is followed by an activity using the Brandt line map and a topological style map identifying urbanised countries. The last big activity is a categorising activity for rural-urban migration vs. natural change.
RESOURCES:
copies of the relevant text book pages, along with shading sheets for urbanisation causes, and gap fill support activity for the demonstrate task.
NOTES:
the construct activity slide for identifying push or pull factors is on an automatic timer. Open the animation pane on the slide to remove if you wish.
Please review with any feedback :-)
Urbanisation, rates of urbanisation, push and pull factors, rural urban migration and natural increase. POSSIBLE DOUBLE LESSON
LESSON INVOLVES:
main features include key word activities exploring and applying the definition of HIC, LIC, NEE, Push and Pull factor. A timed activity where student have 90 seconds to view an image and decide if it is is a push or a pull factor and explain (it is slide 7 - once on the slide click to start the clock, it should go through each image automatically - you can remove the animations if you prefer). This is followed by an activity using the Brandt line map and a topological style map identifying urbanised countries. The last big activity is a categorising activity for rural-urban migration vs. natural change.
RESOURCES:
copies of the relevant text book pages, along with shading sheets for urbanisation causes, and gap fill support activity for the demonstrate task.
NOTES:
the construct activity slide for identifying push or pull factors is on an automatic timer. Open the animation pane on the slide to remove if you wish.
Please review with any feedback :-)
Something went wrong, please try again later.
This resource hasn't been reviewed yet
To ensure quality for our reviews, only customers who have purchased this resource can review it
Report this resourceto let us know if it violates our terms and conditions.
Our customer service team will review your report and will be in touch.
£2.00