

Draw inferences from two data sets by using measures of center and variability. Scaffolded lesson provides for classroom differentiation. Can be used as a lesson leader, guided practice, independent practice, for cooperative learning and math centers, or as an assessment. Use with smartboard, projector, computer, pad or as printable. Lesson is complete - NO PREP. Editable version included.
Objectives:
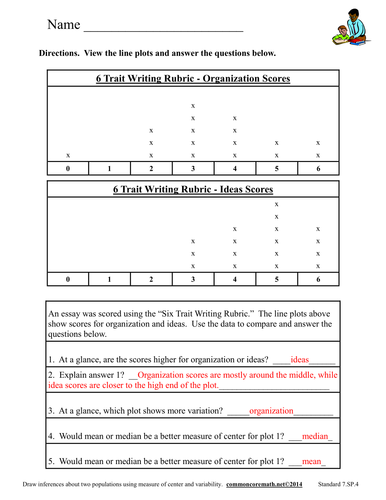
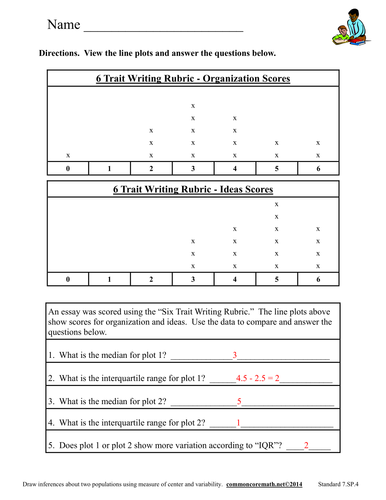
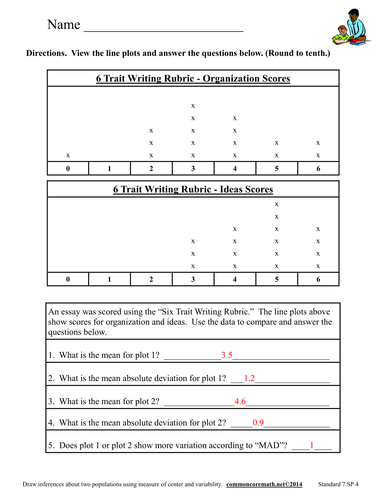
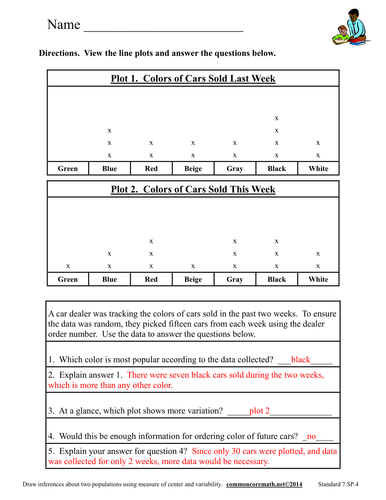
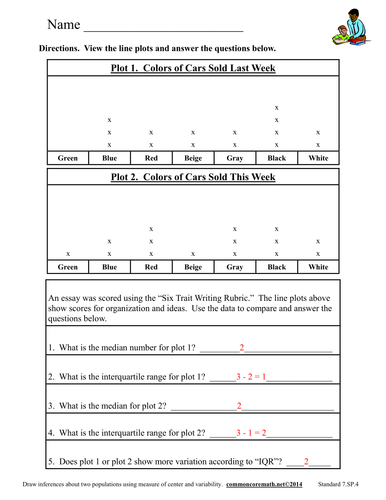
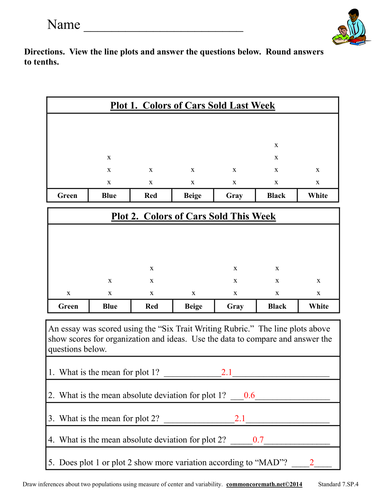
- Compare two sets of data using center (median and mean)
- Compare two sets of data using variability (MAD and IQR)
- Analyze and draw inferences across two data sets
Includes 6 practice pages and answer keys.
Aligned with NCCS Math - 7.SP.4
Visit commoncoremath.net for additional help.
Objectives:
- Compare two sets of data using center (median and mean)
- Compare two sets of data using variability (MAD and IQR)
- Analyze and draw inferences across two data sets
Includes 6 practice pages and answer keys.
Aligned with NCCS Math - 7.SP.4
Visit commoncoremath.net for additional help.
Something went wrong, please try again later.
This resource hasn't been reviewed yet
To ensure quality for our reviews, only customers who have purchased this resource can review it
Report this resourceto let us know if it violates our terms and conditions.
Our customer service team will review your report and will be in touch.
$3.00