

13Uploads
31k+Views
25k+Downloads
All resources
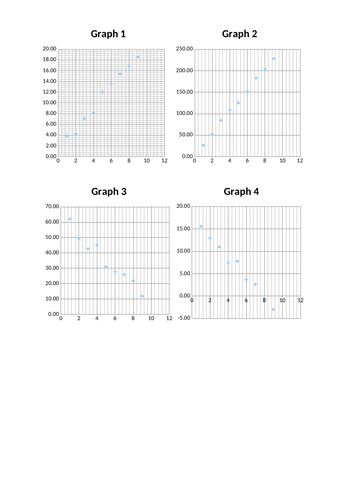
Graph Practice - Draw the line of best fit
This has been designed with a view to being used to give students practice in drawing a line of best fit. The straight line generator can also be used when practicing taking a gradient.
The generators have been set up so that they produce a known shape with a random variation. Some of them have a fairly small variation built in and some have a much higher variation.
You could also give students the data and get them to plot their own graphs.
If you find this resource useful I have a paid version of this resource which allows you to generate points, giving an endless supply of data sets to practice adding scales on a graph for.
Please do let me know if there are any ways in which you feel this resource could be improved.

Practice drawing graphs
A worksheet with 6 tables and 6 sets of pre-labelled axes.
Students need to select the correct graph type and plot the graph. they are also asked to give a conclusion for the graph.
It is not associated with any specific topic and can be used by KS3 or KS4

Graph Practice - Draw the line of best fit GENERATOR
This has been designed with a view to being used to give students practice in drawing a line of best fit. The straight line generator can also be used when practicing taking a gradient.
The generators have been set up so that they produce a known shape with a random variation. Some of them have a fairly small variation built in and some have a much higher variation.
You could also give students the data and get them to plot their own graphs.
There is a free fixed value copy of this resource if you wish to use that. If you find the free version useful come back and purchase the generator to make your own new versions.
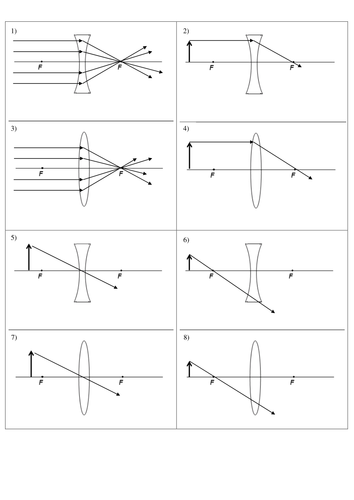
Which ray diagrams are right - lenses
Print out and cut out the diagrams. Students have to identify which diagrams are correct and which diagrams are wrong. Can be used after learning the rules for mirrors as a stretching application activity, or as a main activity / revision activity once the rules have been taught to them.
UPDATED: Now has numbers to allow easy identification when reviewing activity

Graph Practice - add the axes GENERATOR
This exercise is designed for allowing students to practice adding suitable axes to their graphs.
The generator has been set up to have a variety of difficulties. Each random generation will produce a set of axes values and a suitable grid to add the scale onto. The print area has been automatically set up to only print the graphs.
The students then need to add their scale onto the grid lines.
While the axes labels that have been given are for physics topics, it is not topic specific and can be used by any subject which requires graph drawing.
There is a free fixed value copy of this resource if you wish to use that. If you find the free version useful come back and purchase the generator to make your own new versions.
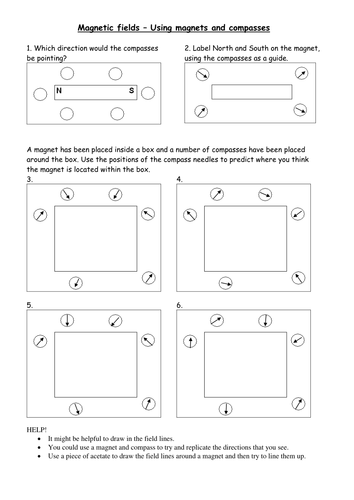
Black box compass positions
This is an extension activity to get students to work with how compasses behave in a magnetic field.
There are 4 'black boxes&' with compass positions drawn around the outside of the box. The students need to work out the position of the single bar magnet inside the box. Print the &';Example fields' onto acetate sheets. These can be used as a help for those finding it difficult, or as a method for the more able to check their own answer. The acetate is placed over the &'black box&'; and the student has to try and line up the field lines with lines of the compass needle.
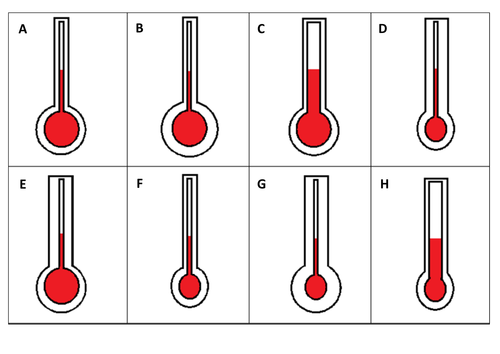
Rate my thermometer: KS4 Physics
Flash cards and accompanying powerpoint (powerpoint can be used on it's own)
Using their knowledge of heat students have to decide on which design of thermometer is best. They should be asked to justify why they have chose one design over another.
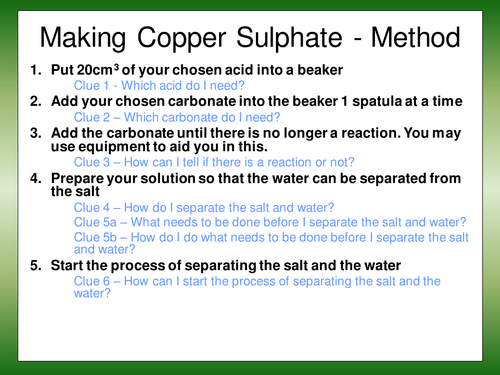
Making copper sulphate - skeleton method
A skeleton method for making copper sulphate. At each stage there is an opt-in clue that the student can choose to look at to ensure they are doing the right method. It is a nice way of differentiating a practical. It is clear at the end who has worked it out correctly as they will have lovely blue crystals at the end.
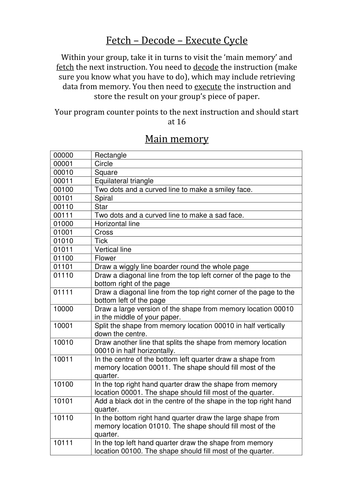
Fetch Execute Decode model
Students work in groups (can be done individually) to follow a set of instructions and create a picture.
They need to visit the ‘main memory’ and fetch the next instruction. Then decode the instruction which may include retrieving data from memory. They execute the instruction and store it by drawing the result on paper.
Activity can be done as a competition. There are a few unused instructions which means they need to keep their program counter accurate. sheet requires denary to binary conversion to start, but this step can be done for the students if that has not been covered

Describing graph shapes
This is an activity I have used with year 7 classes to help them improve their skills in describing graphs, though it could easily be used for other year groups as well.
The students sit face to face, one with sheet one and one with sheet two. They take it in turns to describe the graph shape that they can see, but they are limited in the words that they are allowed to use. The other person has to sketch the graph that is being described. They can then compare to see how well they did.
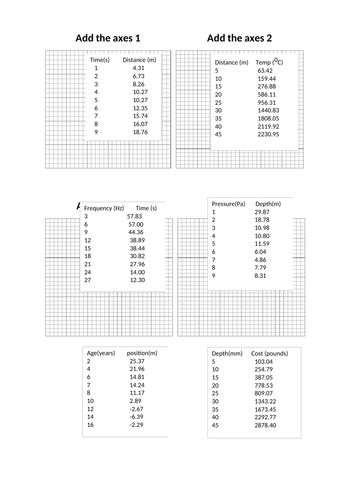
Graph practice - Add the axes
This exercise is designed for allowing students to practice adding suitable axes to their graphs.
There are six sets of data in tables with suitable graph grids.
While the axes labels that have been given are for physics topics, it is not topic specific and can be used by any subject which requires graph drawing.
If you find this resource useful I have a paid version of this resource which allows you to generate new numbers into the tables, giving an endless supply of data sets to practice adding scales on a graph for.
Please do let me know if there are any ways in which you feel this resource could be improved.