
Recent
Most read

As a punishment that can damage a pupil’s chances for life and leave a blot on a school’s record, a permanent exclusion is supposed to be an absolute last resort.
But new figures obtained by Tes reveal that, over the last year, the numbers of pupils who are being subjected to this ultimate sanction have dramatically increased in some areas of the country.
In one local authority, permanent exclusions have risen by more than 300 per cent between 2015-16 and 2016-17.
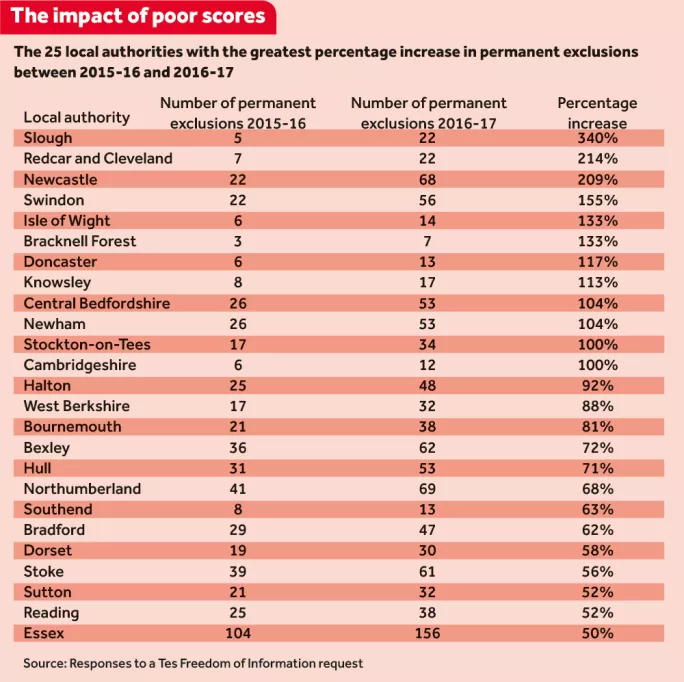
Three areas saw their permanent exclusions triple during the course of a year, numbers at least doubled in 12 authorities and a total of 25 local authorities saw permanent exclusions increase by at least 50 per cent.
Behaviour and exclusion experts attribute these rises to increased pressures on schools, both in academic and financial terms.
“For exclusions to be skyrocketing like that, it has to be biting somewhere,” says behaviour expert Jarlath O’Brien.
The greatest proportional increase nationally was in Slough, where 22 pupils were excluded last year, compared with five pupils the year before - an increase of 340 per cent. Elsewhere, Redcar and Cleveland and Newcastle both had increases of more than 200 per cent.
“It’s incredible, isn’t it?” says O’Brien (pictured, inset). “Some local authorities are doubling in more in one year. These are places that are demographically very different from each other.
“Schools have much fewer staff than they used to. If you have to lose £700,000 in a year, you lose an awful lot of support staff and attendance officers.
“So schools may feel that they have less capacity to handle issues. Instead, they’re excluding pupils.”
Freedom of information requests were sent to all 152 local authorities in England; a total of 118 responded with the relevant data.
The information shows there was an average 12 per cent rise in the numbers of pupils permanently excluded between September 2016 and 30 June 2017, compared with those excluded during the same period the previous academic year.
Like O’Brien, Colin Harris, a retired primary headteacher who has worked as a consultant at a pupil-referral unit, says that lack of funding has led schools to respond more harshly to pupil misbehaviour.
“The last two years have focused the lack of finance,” he says. “When cuts are made, the people supporting mental-health needs, behavioural needs - they get cut back first.
“So what you’ve got is situations where children are not being supported in the way that they were. That will lead to behavioural issues. And - most importantly - to less tolerance for maintaining children with behavioural issues in schools.”
And, Harris says, there has been an increased focus on academic achievement and results in the last two years.
“Ofsted still dominates every headteacher’s waking day,” he says. “Even if you get an ‘outstanding’, you’ve so far to fall. The thought for the majority of heads who I’ve talked to is that the Ofsted report is based on results and attendance.
“Of course, Ofsted looks at exclusions. But there’s no doubt that they’re looking at the overall data far more importantly. It appears that heads are not concerned about getting slapped on the wrist for not supporting a child. So children are very much more quickly excluded and out the door.”
Slough Council says that it will be looking into its 340 per cent rise. “The increased number of permanent exclusions in Slough is set against a context of rising school rolls,” a spokesperson adds.
But in the northeastern borough of Redcar and Cleveland - where there were a total of 22 permanent exclusions in 2016-17, an increase of 214 per cent - other explanations have been suggested.
Simon Kennedy, North-East regional organiser for the NASUWT teachers’ union, says that the increase can be attributed in part to changes in a few local schools.
“In the first few years of academies opening up, they tend to have higher exclusion rates,” he says. “Their behaviour-management processes mean that a child can get a permanent exclusion quite quickly.”
Academy chain Outwood Grange ran one school in Redcar and Cleveland in 2016-17 and began supporting another, which it will take over formally this year. There were nine exclusions in 2016-17 at these two schools, compared with only one in 2015-16.
The local authority points out that, until two years ago, schools in the borough had had “a zero permanent exclusion rate”.
Newcastle, meanwhile, had 22 permanent exclusions in 2015-16, rising to 68 in 2016-17: an increase of 209 per cent. John Hall, NASUWT branch secretary for Newcastle upon Tyne, blames the conditions that schools have to work under.
“The accountability agenda has kind of forced schools to permanently exclude pupils, so that they don’t impact upon the rest of the students, and on [overall] exam results,” he says.
O’Brien believes that the introduction of the Progress 8 accountability measure last year also contributed to the rise in exclusions.
“If your school’s Progress 8 score is looking shaky, a few kids here or there can make quite a big difference,” he says. “Undoubtedly, that’s happened on occasion.”
The Department for Education has pledged to change its methodology for calculating a school’s Progress 8 scores, so that they can no longer be distorted by the performance of just a handful of pupils.
But, says Harris, the tactical use of permanent exclusions to improve results raises questions about their fundamental purpose. “Who is exclusion for?” he says. “It’s certainly not for the child.
“It’s set up purely in order to get the child out of the way, because of results or attendance. Often, there’s no attempt to get to the bottom of what the child’s problem is.”
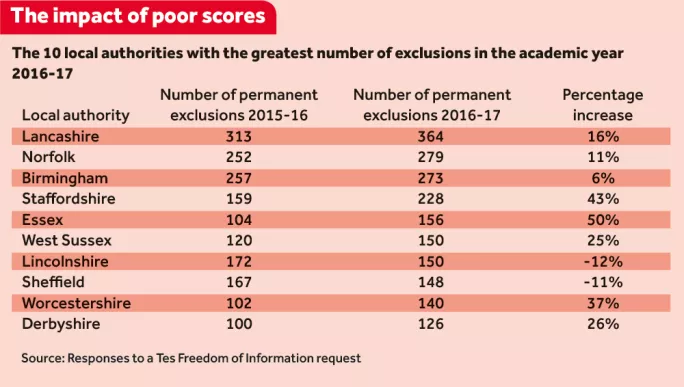
The greatest number of permanent exclusions nationally was in Lancashire. There were 364 in 2016-17, up 16 per cent from the previous year.
Norfolk had 279 permanent exclusions: an increase of 11 per cent. Birmingham had 273 permanent exclusions: 6 per cent higher than in the previous year.
By contrast, the borough of St Helens had two permanent exclusions that same year. Darlington had only one.
A spokesperson for Birmingham City Council points out that it is the largest authority in the country. And a Lancashire County Council spokesperson says that her authority has more schools than any other.
Dan McCarthy, who is the NASUWT member for Norfolk, believes that the fact that his is a rural area has contributed to its high number of exclusions. “In Norfolk, we don’t have many roads,” he says. “You cannot do a managed move to the nearest school, because that school can be very hard to get to. You can’t say you’ve got to go to go to another school if it’s not on the bus route.”
Thirty-four authorities either failed to respond to Tes’ freedom of information request or responded with incomplete information.
A DfE spokesperson says: “Any decision to exclude should be lawful, reasonable and fair. While exclusion can be used as a sanction for schools to deal with poor behaviour, permanent exclusion should only be used as a last resort, in response to a serious breach or persistent breaches of the school’s behaviour policy.
“The law is clear that excluding pupils due to academic attainment is prohibited.”