
Nothing found
Recent
Most read
Most shared

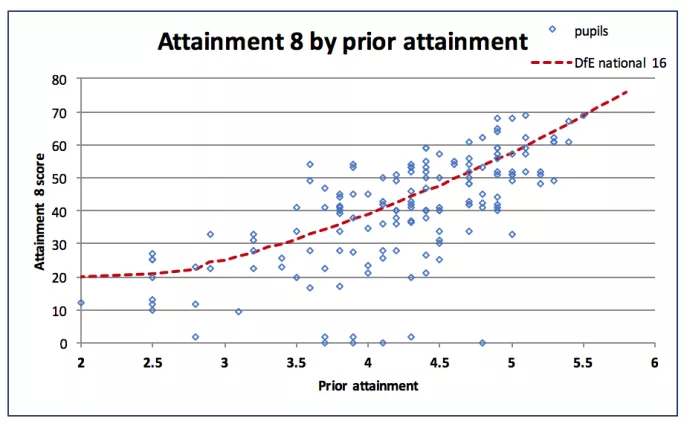
In 2016, the year in which Progress 8 became the headline measure for all schools, a headteacher sent me the following graph of the Attainment 8 scores of his school’s pupils against their prior attainment.
Later that year, the Association of School and College Leaders, where I work, asked heads at its autumn conferences to rate this school based on the graph, without knowing the Progress 8 score in advance.
Most believed the best description was “below average”, although over a quarter felt the school could be viewed as “about average”. However, the actual Progress 8 score for the school was -0.42, well below the coasting threshold and perilously close to the floor. Why is it that so many heads felt it was a better performance than that?
The reason is not that headteachers are bad judges of school performance. In fact, I believe they are particularly good at that and, moreover, they are intuitively pretty good statisticians, too.
The issue is that the Progress 8 score in this school was profoundly affected by the performance of eight pupils with very low Attainment 8 scores. In reaching their conclusions about performance, most heads visually discounted the effect of those pupils and concentrated instead on what the school typically achieved for its pupils.
Removing those eight pupils with the lowest Attainment 8 scores would move the school’s Progress 8 score up to about -0.2, in line with most heads’ views, and arguably indicating that this relatively small school could be viewed as average.
I have always been loath to describe these pupils as “outliers”, even though it is the correct statistical term. The eight pupils in this particular school (and often in schools affected this way) are amongst the most vulnerable of our nation’s young people and in greatest need of the extended provision, support and care that schools give them.
They are often pupils who are difficult to reach, seriously ill, or coping with serious problems at home. Referring to them as outliers seems, to me, to risk losing sight of human issues, and worrying about trivial statistics and decimal places instead. Let’s promise ourselves never to do that if we use the “O” word.
I find myself conflicted about what to do. I can see the argument made by heads in this situation, where the published Progress 8 score seemingly gives the wrong answer. But I can also see the point made by others who say that the score is the score; what matters is how people interpret it and that a single indicator cannot accurately describe the school’s performance in any case.
It’s because governments of all shades believe that headline measures must be pushed so firmly into the public domain that I believe (just) that the right thing to do is to modify Progress 8 scores to take outliers into account.
I don’t believe parents really understand Progress 8 in any case, and I doubt whether many will understand how this issue affects published scores. That’s why ASCL has pressed both the Department for Education and Ofsted to address this problem, and I am pleased they have both responded positively.
In 2018, the DfE has committed to adjusting Progress 8 scores for around 1 per cent of the cohort, which works out at about one or two pupils per school on average. Where a pupil’s score is adjusted, it will still contribute to the Progress 8 score, although the negative impact will be reduced.
Many schools will have no pupils’ scores amended as this is a national level calculation and, quite rightly, no one will know in advance which pupils will be identified. Schools will first see their adjusted and unadjusted provisional Progress 8 scores in September. Performance tables and definitions of the “floor” and “coasting” will be based on the adjusted score.
Ofsted has already started to flag up in the inspection data summary report where pupils’ scores fall far outside the plausible range and where collectively they make a substantial difference to the overall Progress 8 score of the school.
Although this isn’t quite the same definition as the DfE intends to use, it’s a helpful start, and I am sure they will agree their approaches when performance tables are published. And, of course, Ofsted is always at pains to point out that inspection outcomes move beyond any particular performance indicator to take a wider view of the school’s performance.
As we wait for the final method to be resolved, I’d like to suggest a rather simpler way of looking at this. Alongside the arcane overall Progress 8 score, I’ve found it helpful to consider what percentage of pupils in a school made positive progress.
It is likely that this is intuitively what those heads did when they looked at the graph above. In that school, 40 per cent of pupils were on or above the average line, and this seems to convey a different message about the school’s performance than the Progress 8 score. I’m sure the head of that school would have preferred it to be higher, but as a measure, it’s not so badly affected by individual pupils with very low scores.
As part of a collaboration ASCL undertook with SISRA Analytics in 2017, we looked at this measure compared with schools’ overall Progress 8 scores:

Schools in the highlighted area had more than 50 per cent of their pupils with positive Progress 8 scores, but yet had a negative overall score. It could be that these schools were heavily affected by outliers; having both numbers helps us spot where this might have happened.
There is nothing to stop school leaders using this measure regardless of the outlier issue and I’m pretty sure their parents, governors and teachers would find it much easier to understand than a Progress 8 score, possibly negative, correct to two decimal places.
Ultimately, however, the issue of outliers is not the most important question. A much better question would be, “What’s wrong with our accountability system and how do we create a better one?” We need everyone to ask - and answer - that.
Duncan Baldwin is the deputy director of policy at the Association of School and College Leaders
Want to keep up with the latest education news and opinion? Follow Tes on Twitter and like Tes on Facebook