New Department for Education stastics on statistics on special educational needs and disability (SEND) and exclusion rates and reasons were published today. They reveal that:
- The proportion of pupils classed as having SEND in schools fell from 15.4 per cent in 2015 to 14.4 per cent in 2016
The percentage of pupils whose needs are severe enough to require a statement or education, health and care (EHC) plan remained at 2.8 per cent. But the number of pupils who are classified as needing SEND support - extra help which is provided within class - has declined over the past six years. Reforms in the way SEND is identified has contributed to the change, but researchers have said that it could also be a result of pressure on school resources.
- The statistics also show that the pupils with a statement or EHC plan are increasingly likely to attend maintained special schools, up from 41.4 per cent in 2015 to 42.9 per cent in 2016
- Pupils with SEND support were more than seven times more likely to receive a permanent exclusion than other pupils in 2014-15
- And those with a statement or EHC plan were almost seven times as likely to receive a fixed-period exclusion than those with no SEND
- There was a rise in the number of exclusions from schools in 2014-15 compared with the previous year
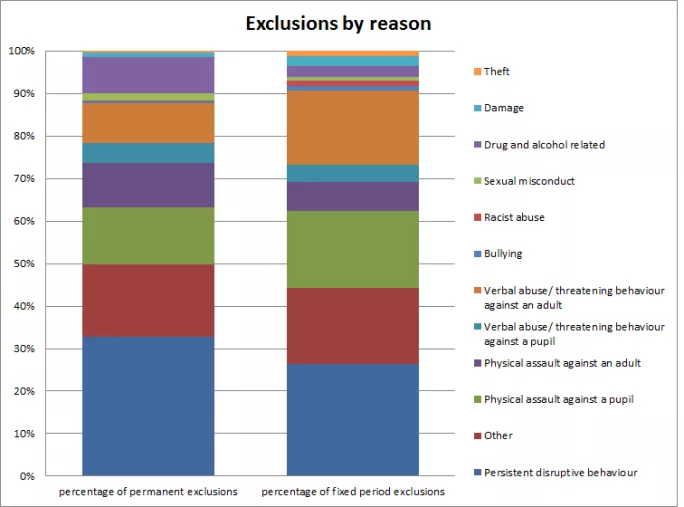
The number went up from an average of 1,446 temporary and permanent exclusions per day in 2013-14 to 1,621 in 2014-15. And the figures reveal that the most common reason for both permanent and fixed-period exclusions was persistent disruptive behaviour.
Want to keep up with the latest education news and opinion? Follow Tes on Twitter and Instagram, and like Tes on Facebook.