
Read more


Recent
Most read
Most shared

The government has this morning released the final key stage 4 figures and performance tables based on the summer’s GCSE results. Schools are now judged against a new Progress 8 measure, rather than the proportion of pupils that achieve five A* to C at GCSE.
Here are some key points revealed in the new statistics:
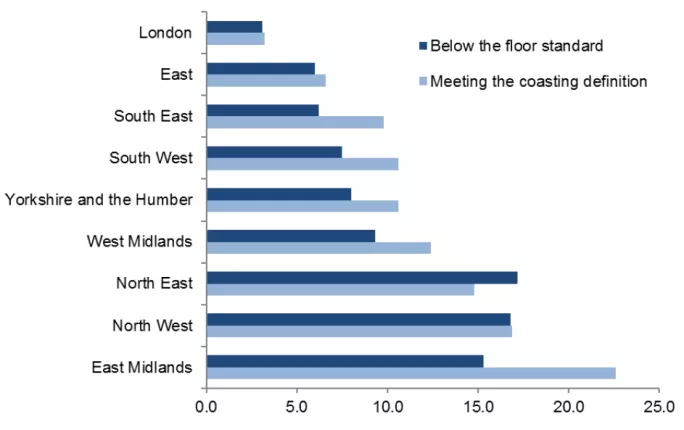
One in six secondary schools in the North West of England is underperforming, figures show.
The region has the highest proportion of pupils attending secondaries that are below the floor and/or are coasting, with 13.1 per cent of its young people being taught in schools that are considered not good enough, according to Press Association analysis.
The figures reveal that Knowsley in the North West has the greatest proportion of schools that are underperforming, with all six of its secondaries below the government’s new floor standard - a Progress 8 score of below -0.5.
At the other end of the scale, London has the lowest proportion of underperforming schools.
More than a fifth of free schools with key stage 4 results have fallen below the new Progress 8 floor standard.
Analysis shows that seven mainstream free schools scored below -0.5, and figures reveal that on average free schools achieved a Progress 8 score of -0.02.
The results could raise questions about the government’s flagship policy around free schools.
But the Department for Education (DfE) says the numbers of free schools with Year 11 pupils are too small to allow robust conclusions to be drawn about their performance at the end of key stage 4.
The DfE does not publish a list of schools falling below the floor standard, but analysis from Press Association found that 107 sponsored academies failed to meet the threshold this year - out of a total of 282 schools.
The analysis also found that 34 converter academies and 51 “council run” schools fell below the floor standard.
And on average, sponsored academies scored -0.14 under the new measure Progress 8.

Selective schools scored a positive 0.33, which is above the national average of 0 and compares secondary moderns’ average score of -0.09.
And the Progress 8 score for the small number of disadvantaged pupils in grammar schools was 0.13, compared with -0.32 for those across all state mainstream schools in England.
Grammar schools were pushed out of the top spots under the government’s new accountability measure this year.
Two faith schools in Blackburn topped the national tables for Progress 8 after recording scores of more than one - a complete grade above their expected results.
Tauheedul Islam girls’ high school scored 1.37 for their Progress 8, meanwhile Tauheedul Islam boys’ school scored 1.15.
Among all schools with more than 50 pupils taking exams, selective schools do not appear until further down the performance tables.
The best-performing selective school, Tunbridge Wells Girls’ Grammar School, recorded a Progress 8 score of 0.82, placing them in 13th place.
Want to keep up with the latest education news and opinion? Follow TES on Twitter and like TES on Facebook