Per-pupil spending by local authorities falls short of 2012 high

The South East is the region spending the least on schools, on a per-pupil basis, Department for Education figures show
21st September 2017, 11:20am

Share

Per-pupil spending by local authorities falls short of 2012 high

https://www.tes.com/magazine/archive/pupil-spending-local-authorities-falls-short-2012-high
Thumbnail

Spending by local authorities on schools is set to rise in 2017-18 compared with last year, but the amount being spent per-pupil will still be lower than it was five years ago, new statistics suggest.

And the amount going to “other” education services - such as education welfare and educational psychologists - has dropped by 5.5 per cent, from £2.7 billion to £2.6 billion. The Department for Education document says this is partly due to the increased number of schools that have converted to academy status.

It adds the drop could also be because some of this spending has moved to a different part of the schools budget as a result of the ending of the Education Services Grant. 

Overall, the schools budget, which is largely driven by pupil numbers, is due to increase by £1.1 billion, or 2.7 per cent, year-on-year.

This is a nominal rise in planned per-pupil spending, from £4,432 last year to £4,475 in 2017-18. However, five years ago, in 2012-13, the figure was £4,594.

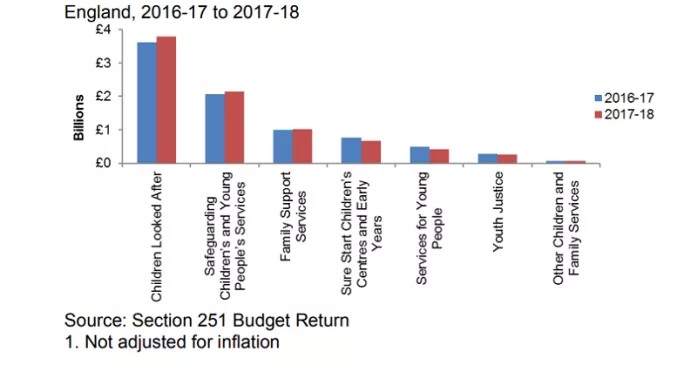
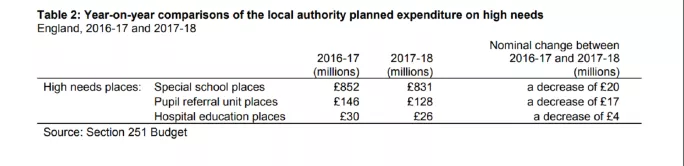
The figures also show that:


  1. The South East has the lowest per-pupil spend, at £4,311 per pupil. Last year, the South West was the lowest spending region on per-pupil funding.

regional differences in la spending on schools

Source: DfE


  1. The biggest increase in children’s and young people’s services is for looked-after children - from £3.6 billion up to £3.8 billion. But Sure Start children’s centres and early years have the biggest decrease in planned spend, from £0.8 billion to £0.7 billion.


differences in la spending on central services

Source: DfE
  1. Less will be spent on special schools, pupil referral units and hospital education places - again, the DfE points out that this can be affected by the number of schools converting to academy status.
high needs table
Source: DfE

Want to keep up with the latest education news and opinion? Follow Tes on Twitter and like Tes on Facebook


Want to keep reading for free?

Register with Tes and you can read two free articles every month plus you'll have access to our range of award-winning newsletters.

Keep reading for just £1 per month

You've reached your limit of free articles this month. Subscribe for £1 per month for three months and get:

  • Unlimited access to all Tes magazine content
  • Exclusive subscriber-only stories
  • Award-winning email newsletters
Recent
Most read
Most shared