


Recent
Most read
Most shared

The government published its annual schools census data today showing the number of pupils and schools in England.
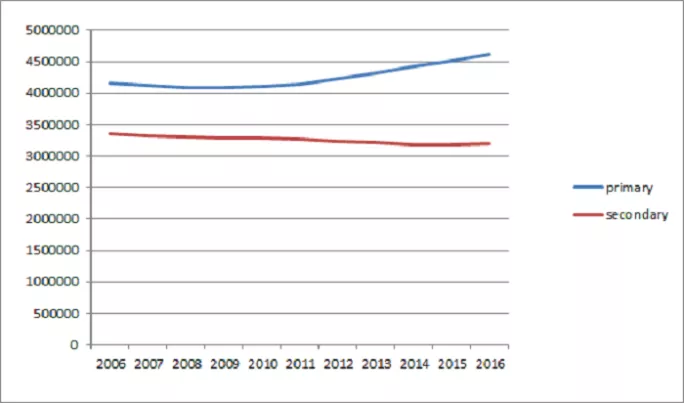
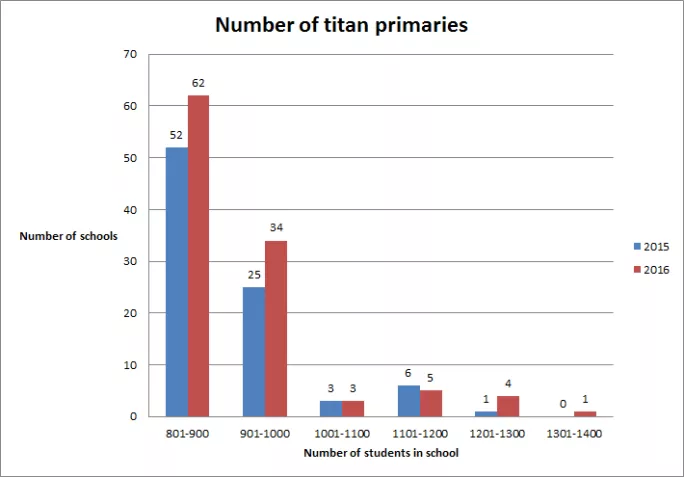
This year’s statistics show that since last year there are more pupils, in fewer schools. There are now 8,559,540 pupils in 24,288 schools. In 2015 there were 8,438,145 pupils in 24,317 schools. That means schools are getting bigger. Claycots primary in Slough is the largest primary in England, and with 1,387 pupils it is the first break the 1,300-pupil barrier. It is expected to expand further and grow to 1,800 pupils.
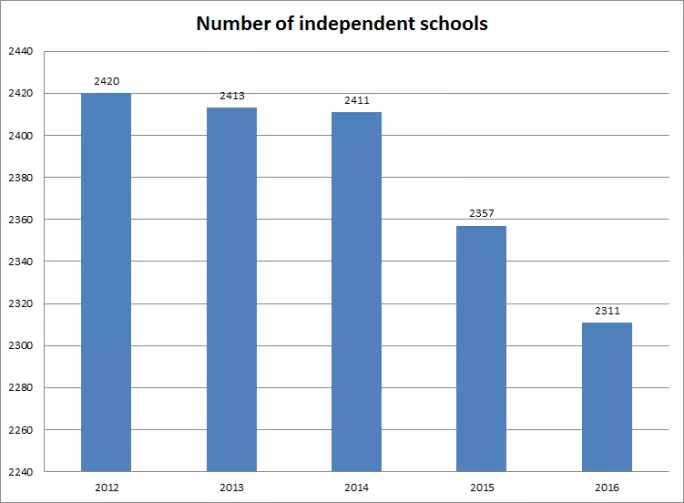
There are 46 fewer independent schools than last year, the figures show, dropping from 2,357 in 2015 to 2,311 in 2016.
The statistics also show that the number of pupils with minority ethnic origins continues to rise slowly - 31.4 per cent of primary pupils and 27.9 per cent of secondary pupils have minority ethnic origins. This compares to 30.4 per cent of primary pupils and 26.6 per cent of secondary pupils in January 2015.
In primary schools, Asian pupils (10.6 per cent) are the largest ethnic minority and white non-British pupils (7.1 per cent) are the second-largest ethnic minority. Black and mixed-race pupils make up 5.7 per cent of pupils in state-funded primary schools, making them the joint third-largest minority ethnic groups.
In secondary schools, Asian pupils (10.3 per cent) are the largest ethnic minority and black pupils (5.5 per cent) are the second-largest ethnic minority. White non-British make up 5.4 per cent of pupils in state-funded secondary schools, making them the third-largest minority ethnic group.
Want to keep up with the latest education news and opinion? Follow TES on Twitter and like TES on Facebook