


Recent
Most read

Earlier this month, we at the Institute for Fiscal Studies (IFS) presented a landmark study of education inequalities that showed there has been “virtually no change” in the disadvantage gap at GCSE for the last two decades, and this gap is set to widen following the Covid pandemic.
In the report, we showed that young people who are eligible for free school meals are around 27 percentage points less likely to earn good GCSEs than less disadvantaged peers. This disadvantage gap is likely to widen as children from more disadvantaged backgrounds suffered around twice as much learning loss as the average pupil during the pandemic.
However, there are further insights that we covered in the report that those in schools and wider education policy should be aware of if we are to address all education inequalities head-on.
Chiefly, these relate to outcomes by gender, ethnicity and place that all need to be understood if we are to ensure everyone has the best possible educational outcomes and life chances.
Differences in educational attainment between boys and girls emerge at an early age.
At the start of primary school, almost 80 per cent of girls are assessed as having a good level of development in meeting early learning goals, compared with 66 per cent of boys.
As figure 1 shows, these inequalities persist through primary school, into secondary school and beyond. Girls do significantly better than boys at every stage of education.
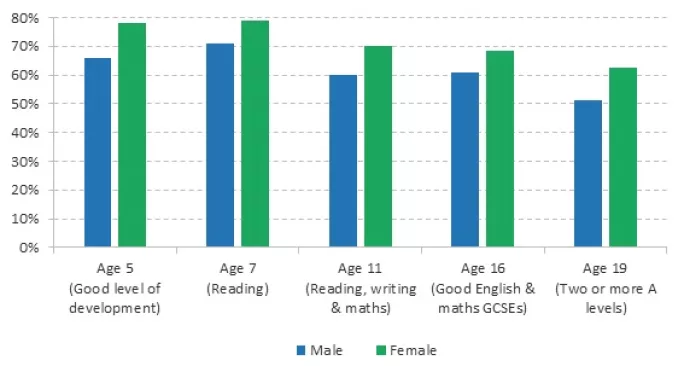
Figure 1: Attainment gaps at different stages of the education system by gender, 2019
Girls doing better at school is not a recent phenomenon. Since GCSEs were introduced in England, Wales and Northern Ireland in 1986, girls have outperformed boys every single year.
Yet, despite higher levels of educational attainment, women still do worse in the labour market. At the age of 40, the median female graduate employee earns roughly £33,000 compared to almost £48,000 for a male graduate employee.
There is a range of different factors that contribute to this earnings gap, including different patterns of working hours and the ”part-time penalty” that many mothers face after having children. But men and women also make different educational choices, with women more likely to take higher-level qualifications but also making quite different course choices from men (as figure 2 shows).
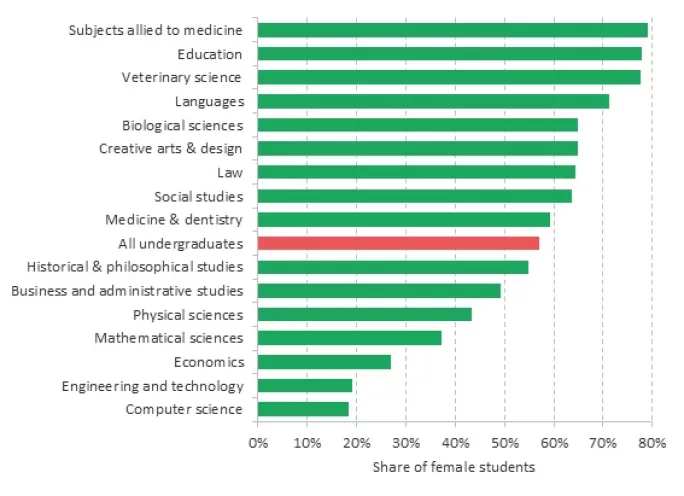
Figure 2: Share of female students in different degree subject areas, 2018-19
While women are over-represented in a few science-related subject areas, such as subjects allied to medicine (eg, nursing), fewer than half of students studying science, technology, engineering and maths (Stem) subjects are female. Women are particularly under-represented in engineering and technology and computer science courses, where they make up less than one-fifth of the student body.
This gender difference in subject-taking is important because some of the courses where women are under-represented, like economics and engineering, are associated with high future earnings.
The picture of inequalities by ethnicity is more nuanced. Children from ethnic-minority backgrounds start with worse outcomes than their white British peers but, by the end of secondary school, they have largely caught up.
As we see in figure 3, children from Asian and black ethnic backgrounds were considerably less likely to reach a good level of development during Reception.
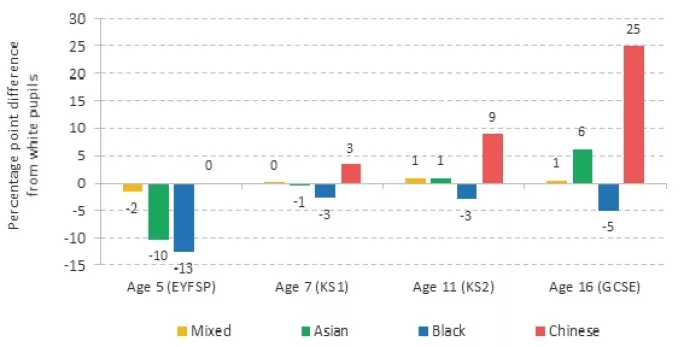
Figure 3: Attainment gaps between ethnic-minority pupils and white students at different stages of education, 2019 GCSE cohort
During the school years, the performance of ethnic minorities improves relative to their white British peers. And by age 16, children from Asian and Chinese ethnic backgrounds, in particular, have above-average attainment.
Young people from ethnic minorities are also far more likely to progress to higher education. Figure 4 presents the share of young people from each ethnic group progressing to higher education by the age of 19.
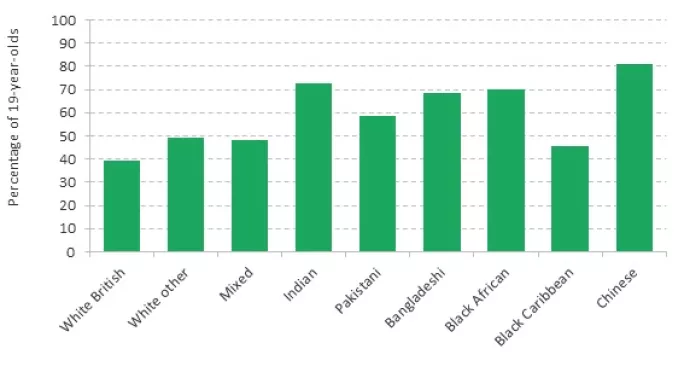
Figure 4: Progression to higher education by age 19 by ethnicity, 2021
Around 40 per cent of white British pupils have progressed to higher education by the age of 19, which is the lowest of any ethnic group.
This is especially striking since many ethnic-minority groups have other characteristics that are associated with a lower chance of earning a degree. For example, while 22 per cent of white British students are eligible for free school meals, 29 per cent of students of Bangladeshi heritage and 33 per cent of students of black African heritage were eligible.
However, for women, higher levels of educational attainment do not necessarily translate into better labour market outcomes. A recent IFS report shows that despite better educational attainment, there remains an employment disadvantage for minority-ethnic groups.
We have so far looked at gender and ethnicity independently, but there are important intersections between these characteristics. In figure 5, we show how inequalities by gender and disadvantage (as captured by eligibility for free school meals) vary by ethnicity.
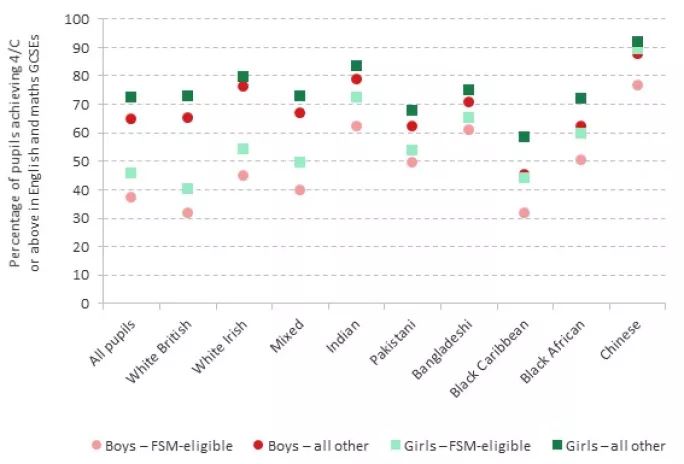
Figure 5: GCSE performance by eligibility for free school meals, gender and ethnicity in 2019
Disadvantaged boys from a white British background or a black Caribbean background have the lowest levels of GCSE attainment.
This is, in some sense, unsurprising: being a boy, being eligible for free school meals and being from a white British or black Caribbean background are each associated with lower levels of attainment.
Children who are eligible for free school meals perform worse in every ethnic group, but the size of the gap varies. The FSM attainment gap is largest among white British boys (33 percentage points), white Irish boys (31 percentage points) and boys from a mixed background (27 percentage points). By contrast, among boys of Bangladeshi heritage, the FSM gap is less than 10 percentage points.
There is less variation in the size of the gender attainment gap. The largest gender gap in attainment is among black Caribbean pupils, where girls are 13 percentage points more likely than boys to achieve good GCSE results (regardless of their eligibility for free school meals).
More recently, the debate on education inequalities has shifted to focus on the levelling-up agenda, with a focus on increasing attainment and reducing inequalities between areas.
There are large geographic differences in educational attainment, with schools in London outperforming those in other parts of the country.
This is illustrated by figure 6, which plots the 152 local education authorities (LEAs) in England based on the share of their pupils who reach the expected level in reading, writing and mathematics by the end of primary school.
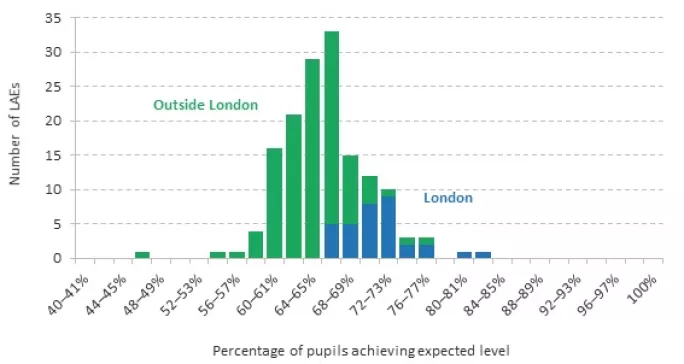
Figure 6: Distribution of LEAs based on the share of primary school leavers meeting the expected level in reading, writing and maths, 2019
Nationally, 65 per cent of pupils met this benchmark in 2019 (down to 59 per cent for the 2021-22 school year, and set against a government ambition to reach 90 per cent by 2030). But this 2019 average masks substantial geographic variation.
While London LEAs make up just over a fifth of councils in England, more than two-fifths of LEAs with above-average results are located in London. More than three-quarters of LEAs where at least 70 per cent of pupils meet this benchmark are in London, and even the worst-performing London LEAs are still above the national average.
Geographical differences are also apparent in GCSE results. In figure 7, we illustrate the share of pupils achieving pass marks (grade 4/C) in GCSE English and maths in each local authority.
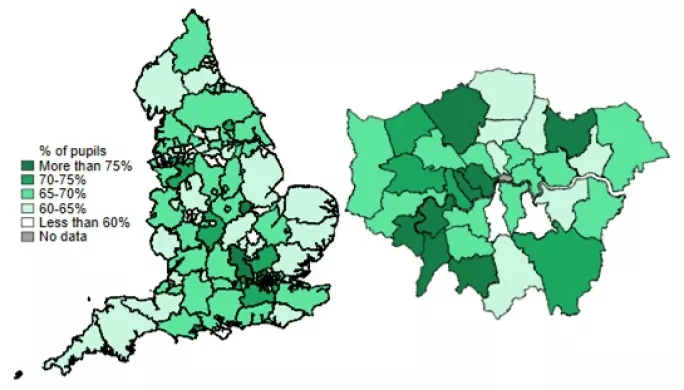
Figure 7: Share of pupils obtaining good English and maths GCSEs, 2018-19 GCSE cohort
The share ranges from just over 40 per cent in Knowsley to 80 per cent in Trafford. Overall, though, GCSE performance tends to be lower in the north of the country, as well as in inner-city areas.
While there are sizeable geographic differences in educational attainment, a lot of this is explained by the demography of the children in each region. Figure 8 shows how inequalities by gender and disadvantage vary across the regions of England.
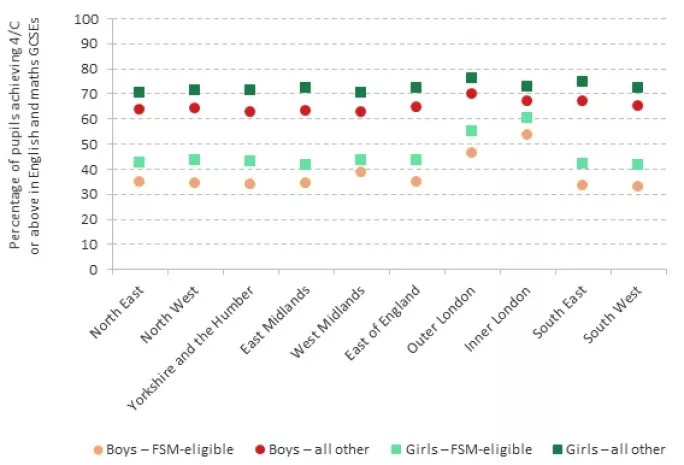
Figure 8: GCSE performance by eligibility for free school meals, gender and region, 2019
What stands out is how similar most regions look. Across most of the country, the differences across regions are dwarfed by the impact of disadvantage - particularly socioeconomic disadvantage - within the region.
Once again, though, London stands out as an outlier where the disadvantage gap is far smaller than in other regions.
There are countless ways to look at differences in educational attainment, which is why education inequalities are nuanced and unpacking them is a complex task. Here, we have shown it is necessary to look beyond disadvantage - there are sizeable differences in educational attainment and choices by gender, ethnicity and place. The intersections between these dimensions are also important.
Ultimately, understanding and addressing these inequalities is crucial for targeting support to where it is most needed.
Imran Tahir is a research economist at the Institute for Fiscal Studies and an author of the ‘Education inequalities’ chapter of the IFS Deaton Review