


Recent
Most read

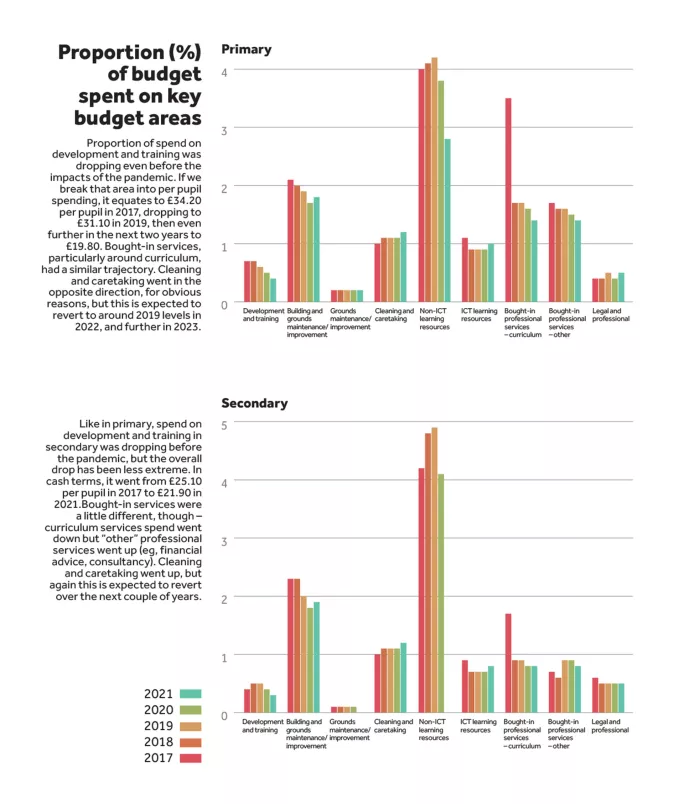
The proportion of spend on development and training was dropping in primary settings even before the impacts of the pandemic. If we break that area into per-pupil spending, it equates to £34.20 per pupil in 2017, dropping to £31.10 in 2019, then even further in the next two years to £19.80.
Bought-in services, particularly around curriculum, had a similar trajectory. Cleaning and caretaking went in the opposite direction, for obvious reasons, but this is expected to revert to around 2019 levels in 2022, and further in 2023.
Like in primary, spend on development and training in secondary was dropping before the pandemic, but the overall drop has been less extreme. In cash terms, it went from £25.10 per pupil in 2017 to £21.90 in 2021.
Bought-in services were a little different, though - curriculum services spend went down but “other” professional services went up (eg, financial advice, consultancy). Cleaning and caretaking went up, but again this is expected to revert over the next couple of years.