


Recent
Most read

Now the dust has settled on last week’s A-level results, the Sutton Trust has delved further into the data to examine what it means.
As the graph below shows, one of the major stories from the day was the widening regional inequality within England, with London and the South East stretching further ahead of the rest of the country, and the North East and Yorkshire falling further behind.
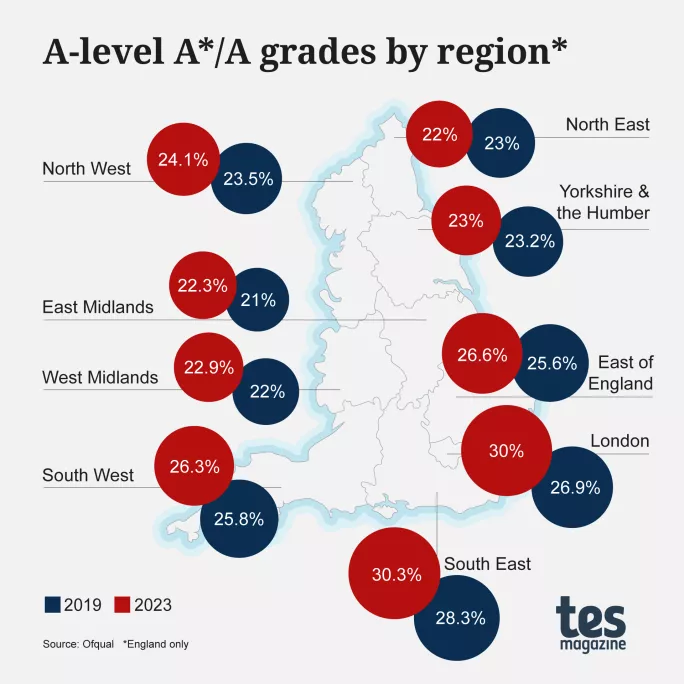
While we won’t see data on free school meal eligibility until later this year, the difference in prosperity is clearly one potential explanation.
Having published county-level data on grades for the first time this year, Ofqual has provided an opportunity to explore this hypothesis further. One useful measure for this is the index of multiple deprivation (IMD).
The IMD is useful because it ranks all the neighbourhoods in England on a scale from most to least deprived, combining several aspects of deprivation including income, education and health into one single measure.
Using the IMD to match area-level estimates of deprivation to the Ofqual data gives the clearest picture yet on the impact of poverty and inequality on this year’s A-level grades.
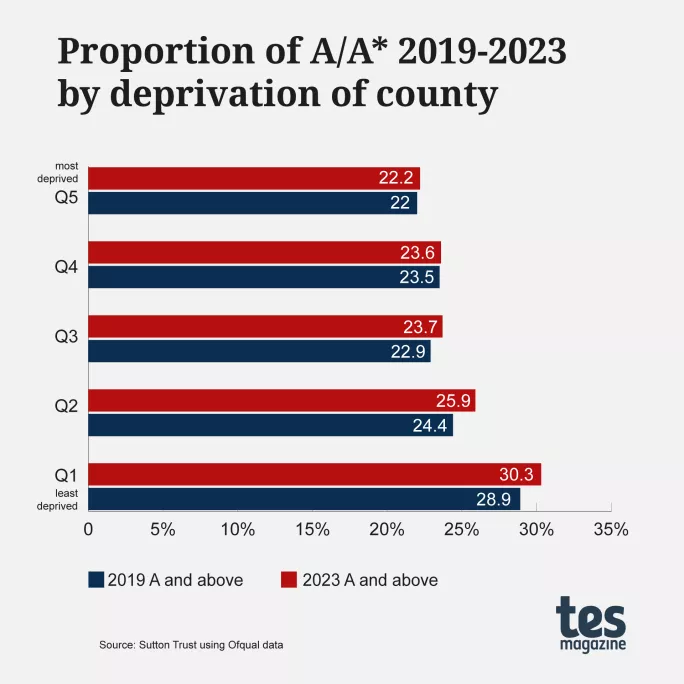
Breaking the counties into five roughly equal groups and looking at the proportion of students achieving A* and A in their A levels demonstrates a clear pattern of those in the most affluent areas performing best. This also reflects a similar pattern pre-pandemic in 2019.
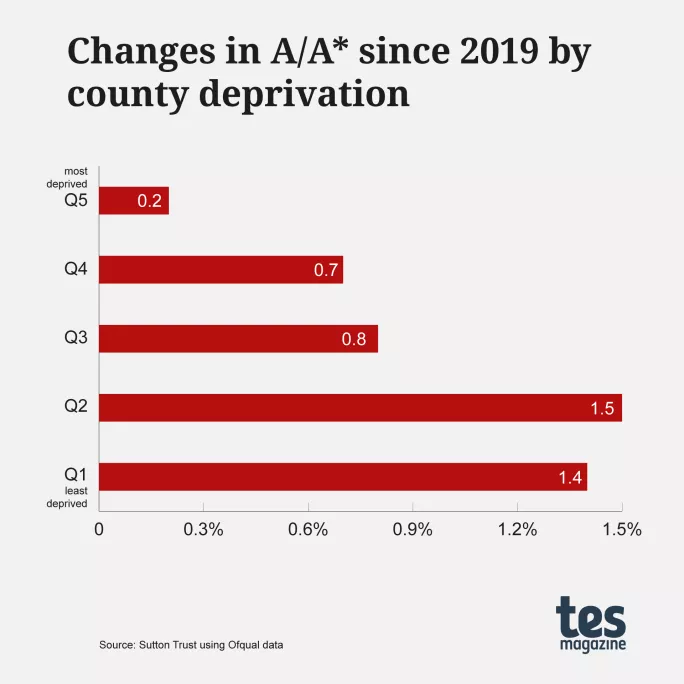
Looking at the average change in grades between 2019 and 2023 shows clearly how things have changed. While the most deprived areas saw a small 0.2 percentage-point increase in top grades over that time, the least deprived (most affluent) areas’ proportion increased by around 1.5 percentage points.
Furthermore, if we look at the proportion of A and A* grades as a whole by county deprivation levels, we see that the most deprived quintile has increased its proportion by only 0.2 percentage points since 2019, while the least deprived counties have increased their proportion of the highest grades by 2.4 percentage points.
Last year’s results showed a ten-year reversal in progress on the attainment gap. These results starkly demonstrate how, on a county-by-county basis across England and Wales, the gap in attainment between the poorest and most affluent areas of the country has widened.
So, what can be done? The following measures could help to close the attainment gap and avoid creating a “lost generation” of social mobility.
The figures above demonstrate the challenge ahead for closing the attainment gap and genuinely “levelling up” the most deprived parts of the UK.
The government could start by urgently setting out a national strategy to close the attainment gap in schools, backed by sufficient funding and targeted at disadvantaged pupils in the most deprived areas.
This should also incorporate an extension of pupil premium funding to those in post-16 education - disadvantage doesn’t stop at age 16, so the associated funding shouldn’t stop either.
Refocusing on tutoring, which is one of the most powerful interventions to narrow the attainment gap, could also make a big difference.
Despite its at times rocky genesis, the National Tutoring Programme should be put on a longer-term footing and focused on those from disadvantaged backgrounds, while those in post-16 education also require greater access to tutoring support.
Carl Cullinane is director of research and policy at the Sutton Trust