


Recent
Most read

New key stage 1 assessment and phonics data, released this week, have underlined the impact the pandemic took on many pupils’ educational outcomes.
The data released by the government contains all manner of different insights on the data, both for phonics and teacher assessments on reading, writing and maths.
We’ve been through the data to pull out the top-line insights by section, to help you spot the key issues that may need to be looked at for the years ahead.
The top line finding for phonics scores shows a clear decline, with only 75 per cent of pupils meeting the expected standard in the phonics screening check in Year 1, down from 82 per cent in 2019.
Meanwhile, while 87 per cent of pupils met the expected standard in the phonics screening check by the end of Year 2, this was down from 91 per cent in 2019.
A notable trend in the data is the clear decline in outcome by month of birth, with September-born children doing the best in the most recent data (83 per cent hitting the expected standard) and August-born children - ie, born a full 11 months later - the worst, at 67 per cent.
The months in between show a steady decline as the age of children reduces, too.

Such trends were evident before the pandemic, too - when the split was 88 per cent v 74 per cent in 2018-19 for September v August-born children.
For many, this will only reinforce the idea that tests at that age are unfair, given that September-born children will have had almost 12 months of extra brain development before sitting the tests.
Nonetheless, the data will be useful to help teachers identify if younger children in their class are indeed behind and may need extra support in the year ahead.
The impact of the pandemic on the disadvantage gap was one of the big concerns of the past few years with regards to how it would disproportionately impact certain children - and sadly so it has proved.
Overall, while the number of non-disadvantaged pupils reaching the expected level of the phonics check fell by just four percentage points from 84 to 80 per cent, the decline for disadvantaged pupils was much starker, falling from 71 per cent to 62 per cent.
This means the gap between the two is now 17 percentage points, up from 14 percentage points in 2019.
Outcomes for pupils with special educational needs or disabilities make for interesting reading as although there is a decline here too, there are notable differences in who was affected most.
Overall, the percentage reaching the phonics expected standard declined from 43 per cent before the pandemic to 38 per cent now.
However, for pupils on an education, health and care plan (EHCP), the outcome stayed the same, with 19 per cent achieving the phonics standards before and after the pandemic.
For wider pupils with SEND though the decline was 48 to 44 per cent. Overall, this appears to underline why achieving an EHCP is considered so important for parents and potential reform of the SEND system - as set out in the Green Paper earlier this year - is seen by many as so necessary.
As happens every year, more girls than boys meet the expected standard in the phonics screening check, and this year the drop in performance has been felt equally by both genders.
The gap between girls and boys remained stable at 7 percentage points, the same as in 2019, but has declined from 85 per cent to 79 per cent for girls and 78 and 72 per cent for boys.
When the performance is broken down by region, we see small differences in the percentages of students reaching the expected standard. This year, those differences remain broadly the same.
In London, 78 per cent of students reached the expected standard in phonics, whereas in the North West and the East of England it was lower at 74 per cent.
In fact, no region was above 80 per cent whereas, before the pandemic, all regions were above 80 per cent, underlining the scale of the impact.
This year, following feedback from users, the Department for Education has decided to change how Chinese ethnicity is recorded.
This means that Chinese pupils are now listed as Asian - Chinese and it also notes that these pupils were the highest-achieving group to reach the expected standard (86 per cent).
Consistent with previous years, Irish Traveller pupils were the lowest performing group where only 35 per cent met the expected standard, followed by Gypsy and Roma Traveller pupils where a similar figure of 36 per cent met the expected standard.
As with phonics data for KS1, there is an evident decline before and after the pandemic, with writing hit the hardest in terms of the number of pupils hitting the expected standard at just 58 per cent, which was caused by the biggest fall (11 per cent).
The government data shows that:
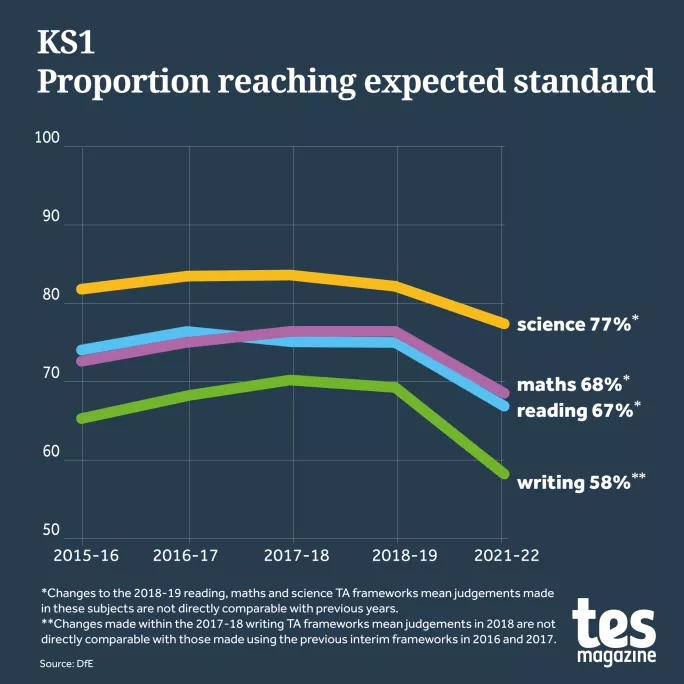
Outcomes at the higher standard also fell, with writing again the biggest area to suffer.
There is no higher standard for science.
This sizeable decline in writing scores was expected, with prior research predicting this. No doubt this is something schools are well aware of and working hard to rectify.
Within these figures, there are many variations by gender, ethnicity and disadvantage - but let’s turn first to geography.
The geographical spread by subject is notable, with London performing the strongest with 70 per cent of pupils meeting the expected standard for reading, 63 per cent for writing and 71 per cent for maths
Conversely, the North West fared the worst, with 65 per cent of pupils meeting the expected standard for reading, 55 for writing and 66 per cent for maths.
The tables below show the full data for each region and, again, shows the extent to which writing fell compared to the other subject areas.
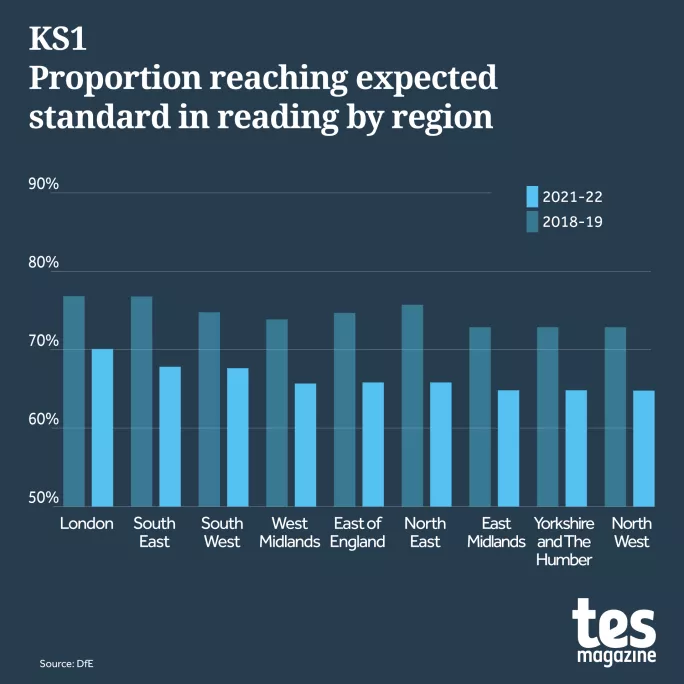
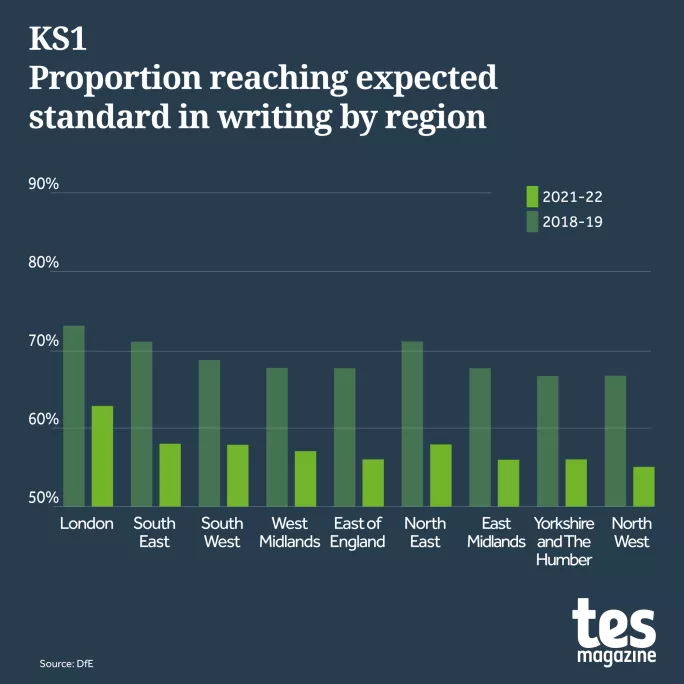
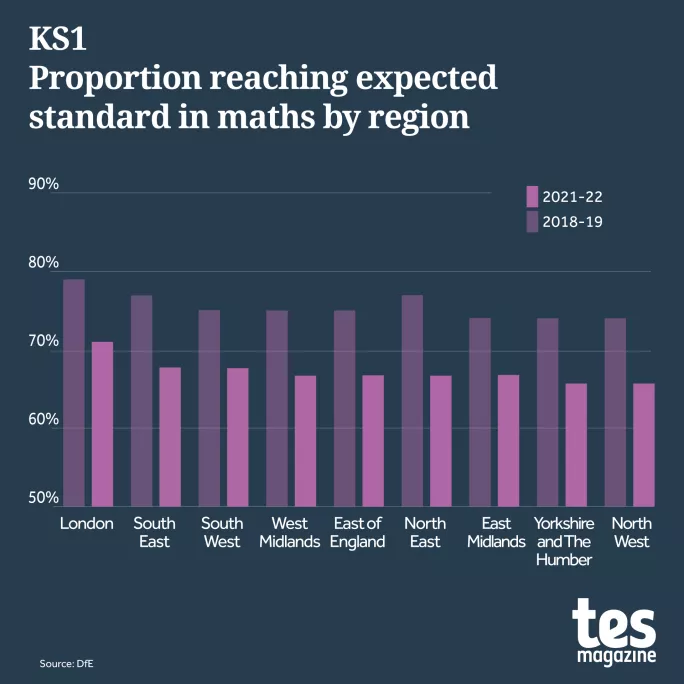
This regional disparity was expected, with the government’s own reports forecasting this - and will no doubt further fuel the debate about the need to ensure adequate funding and resources are given in a manner that benefits the schools that need it most.
A similar tale was also seen in secondary data with this year’s exams, underlying how endemic this problem is and could well last for another entire school generation if the data for this age group persists through their time in school.
Data for students with SEND also show declines akin to the wider cohort, but there are some anomalies within this worth flagging.
For example, students with an EHCP maintained the same level of outcomes as before the pandemic with regards to maths (14 per cent) and fell one per cent for reading (12 per cent) and 2 per cent for writing (7 per cent).
For pupils classed as receiving SEND support, the decline was larger, with reading falling 3 per cent to 30 per cent achieving the expected standard, writing falling 5 per cent to 20 per cent, and maths 3 per cent to 33 per cent.
As with phonics, there is a clear trend by which the month you are born impacts your outcomes.
For example, those born in September received the best outcomes in each subject, and those in August the lowest.
As a stark example, only 46 per cent of pupils born in August hit the expected writing standard, compared to 68 per cent of September-born children.
This is a trend that was just as evident before the pandemic - with the above example equating to 58 per cent of August-born children hitting the expected writing standard and 79 for September.
This will no doubt be used as evidence by those who argue tests at this age are too skewed by the month a pupil is born, and are not a fair way of sampling across a year group.
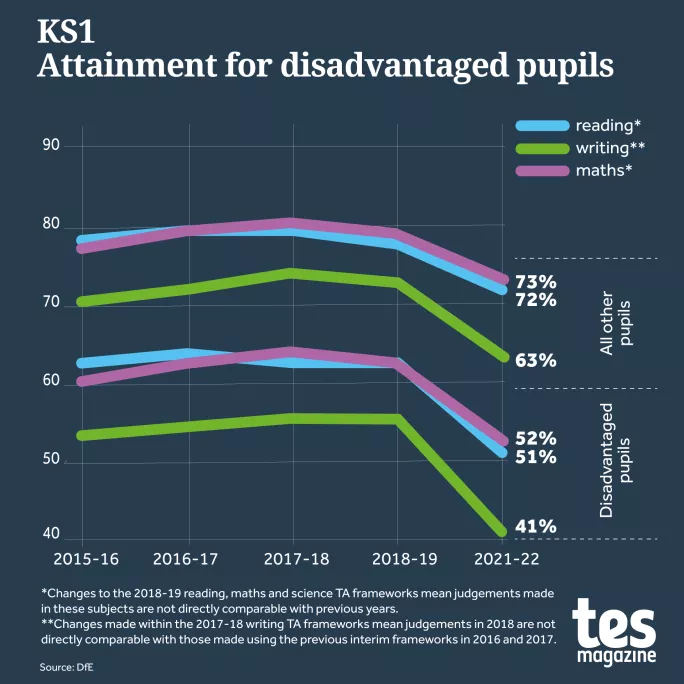
One of the most striking elements of the government data is that it shows the huge impact the pandemic has had on the disadvantage gap.
For example, only 51 per cent of disadvantaged pupils achieved the expected standard in reading, 41 per cent in writing and 52 per cent in maths.
This compares to 72 per cent of non-disadvantaged pupils who achieved the expected standard in reading, 63 per cent in writing and 73 per cent in maths.
Coinciding with this was a clear rise in the number of pupils classed as disadvantaged across the pandemic, which hit 25 per cent - up from 21 per cent in 2019.
For all in education this data makes for grim viewing - not least because it undoes years of slow but steady progress in improving outcomes for disadvantaged pupils and makes the gap between them and their better-off peers even wider.
Jon Andrews, head of analysis at the Education Policy Institute, said it undid ten years’ worth of progress: “We know that the disadvantage gap for 11-year-olds is now around the same level as it was in 2012, taking us back a decade. Today’s data for younger pupils highlights again the level of challenge in addressing that disparity.”
Finally, gender gaps remain evident among these young cohorts with girls outperforming boys in reading (71 per cent v 63 per cent for hitting the expected standard) and writing (64 v 52 per cent).
However, boys performed stronger in maths, but only just: 67 v 68 per cent.
Finally, the data shows a huge variation in how different ethnicities were impacted by the pandemic.
While all ethnicities saw a decline, as you would expect, the data for White Gypsy, Roma and Irish Travellers is especially stark, with figures as low as 18 per cent for meeting the expected standard in writing in both groups.