


Recent
Most read

After a delayed start due to the pandemic, the multiplication check was rolled out to all primary schools for the first time in 2022 with the results published today by the Department for Education.
Although this means there is no previous data to compare these results to, there are nonetheless several interesting insights that school leaders and classroom teachers should be aware of.
First, it’s worth understanding how the test works and its purpose.
The multiplication tables check aims to determine whether Year 4 pupils can recall their two to 12 times tables “fluently”.
To do this, a test is performed on a computer, and the 25-question test gives pupils six seconds to respond with an answer to each question with a three-second pause between each question.
Pupils have a chance to “test drive” the computer program before they take the test, and in the months leading up to the test there is a practice version for schools to use with their Year 4 learners to acquaint them with the software.
Pupils take the test without calculators, nor are they allowed any writing implements.
There is no pass mark, and the data is not used to inform league tables or broken down by school.
James Bowen, director of policy at the NAHT school leaders’ union, said that, for many schools, the data “won’t really tell them anything that they didn’t already know” as regular times table testing is common and teachers won’t be “waiting for a national check to determine how their pupils are doing in this particular area of maths and whether they need additional support”.
However, the DfE says it hopes the results will provide teachers with “standardised information to help to identify pupils who have not yet mastered their times tables, so that additional support can be provided”.
If that is to be the case, here are some of the key insights from the data that schools may wish to be aware of to compare against their own setting’s outcomes.
Without previous years to compare to, it’s difficult to say whether the results for this year group indicate a significant strength in the recall of times tables.
However, it is clear from the table below that the vast majority of learners found the test within their realms of capability with an average score of 19.8 and the most common score a full 25 out of 25 with 27 per cent of pupils securing this score.
A full breakdown of the results is below.
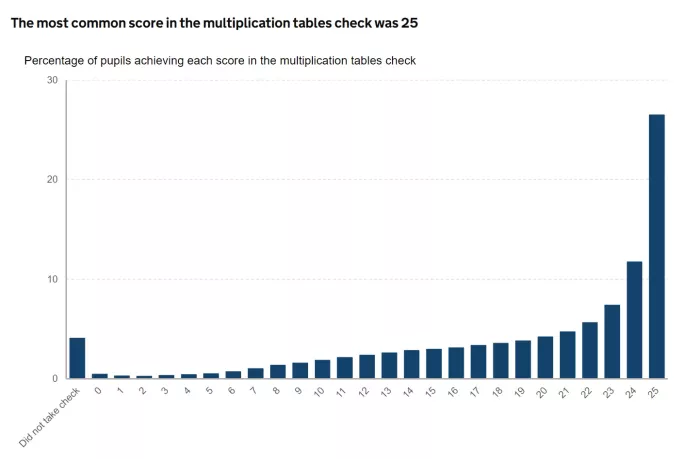
Source: DfE: Multiplication tables check attainment, Academic Year 2021/22
In their summary, the DfE notes that while the average score for pupils not known to be disadvantaged was 20.5 - among disadvantaged pupils, this dropped 2.6 percentage points to 17.9.
Even starker differences become apparent when you look at the number of pupils scoring full marks.
Although full marks were the most common score for all pupils - at 27 per cent - only 18 per cent of disadvantaged pupils secured full marks compared to 30 per cent for non-disadvantaged pupils.
It’s also concerning to see that when looking at the number of pupils who participated in the check, only 93 per cent of disadvantaged pupils were entered for the check, compared to 97 per cent of pupils not known to be disadvantaged. This amounts to 12,979 disadvantaged pupils not taking the check.
Whereas girls usually outperform boys in assessment outcomes, the multiplication check actually has boys doing better - with a mean average score of 20 compared to 19.6 for girls.
It’s not a big difference but notable nonetheless. It is worth pointing out that more girls took the test - 97 per cent who were eligible compared to 95 per cent of boys.
Overall the most common score for girls and boys was full marks - although more boys (28 per cent) scored this compared to girls (25 per cent). The table below shows the full breakdown of marks by gender.
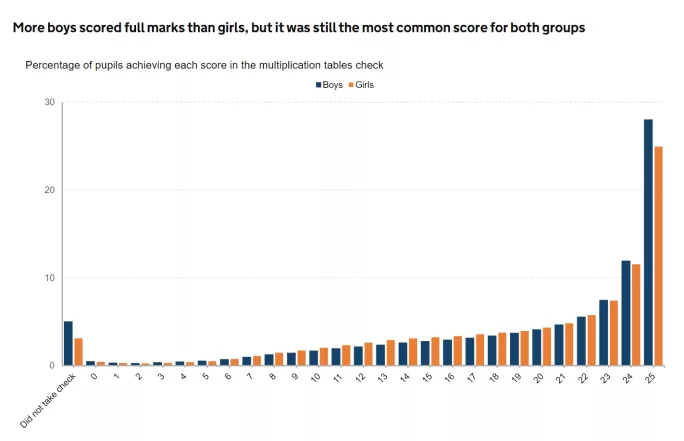
Source: DfE: Multiplication tables check attainment, Academic Year 2021/22
This trend held true when looking at disadvantaged pupils, with 17 per cent of disadvantaged girls scoring full marks compared to 20 per cent of disadvantaged boys achieving 25 out of 25.
A notable insight from the DfE data is that pupils who are classed as “known or believed to be other than English” performed better than pupils classed as “known or believed to be English”.
Specifically, those in the first group scored a mean average score of 21.2 compared to those in the second group who scored 19.4.
The most common score in both groups was also full marks, although there was a clear difference here, too, with 24 per cent of known to be English pupils scoring full marks compared to 36 per cent of known or believed to be other than English.
Diana Sutton, director of The Bell Foundation, said those pupils who have English as a second language have performed well because maths and times tables rely less on English language skills.
“EAL learners who have had a good previous education can find it easier to demonstrate their ability in maths than in other subjects,” she notes.
“This is because some maths notations may be familiar because they are used in other languages, and some mathematical topics are very visual, eg, time, height, length, weight.”
She says though that education - particularly at secondary school - needs to recognise this benefit won’t last forever but should be harnessed where possible.
She said: “As learners progress to secondary, there will be more English language required to access maths lessons, and in particular word problems.
“EAL learners, particularly those who have not been in the UK system for very long, are likely to need more support to understand the key features of mathematical language as well as knowledge which are essential for success in the subject.”
As is often the case, pupils born in the autumn months did better than their summer-born classmates. Specifically, September was the strongest month with a mean average score of 20.6 before gradually reducing across the year to August with a mean average score of 19.
It’s not a huge difference but highlights once again the issue with tests conducted with young learners, given that autumn-born children have had a lot more brain development time compared to those born in the summer.
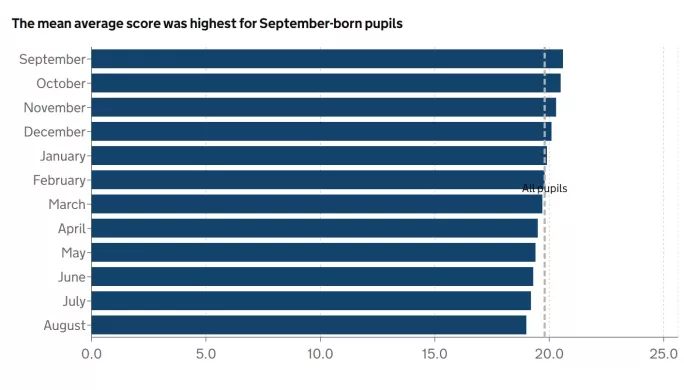
Source: DfE: Multiplication tables check attainment, Academic Year 2021/22
There were some clear regional variations in the data - with London scoring the highest (20.9 mean average score) compared to the South West at the other end of the scale (19.1)
In fact, the performance of London appears to have dragged up the overall score quite a lot, with the region the only one above the average of 19.8.
Of course, London has the highest number of pupils per region and the highest number of pupils known or believed to be other than English - 49 per cent - the group that scored the best on the tests.
Dave Thomson, chief statistician at FFT Education Datalab, says, as a result, it is “no surprise that attainment in London was higher” and notes that this is usually the case with most data sets.
“It’s the same in any key stage you choose to mention. DfE has published early years foundation stage data today and London leads the way in that as well.”
He notes too that even if you weighted the data to assume a theoretically 50/50 split in language between known or believed to be English and known or believed to be other than English, London would still perform the highest although the gap would be smaller.
Pupils with special education needs or disabilities (SEND) were also eligible for the test - including those with an education, health and care plan (EHCP).
Of those that did take the test, the highest outcome for children with SEND was full marks at 11 per cent and 6 per cent for those on an EHCP.
It should be noted though that in both categories there were high numbers who did not take the test - 54 per cent for pupils on an EHCP and 7 per cent for children with SEND.
Although this data isn’t used to assess schools, it will be interesting to see how the introduction of the multiplication test check might make a difference to the mathematical performance of the cohort when it comes to their key stage 2 Sats.
Before that, though, it will perhaps be more instructive to compare the next set of results in 2023 to this year’s outcomes, so we can start to compare cohorts and if the test increases focus on multiplication tables teaching in schools.