


Recent
Most read
Most shared

An attainment gap between regions in the North and South of England in terms of the proportion of A-level exam entries achieving top grades has widened since exams were last held before the Covid pandemic.
The gap between the North East, which received the lowest proportion of A-level A* and A grades out of all the regions (30.8 per cent), and the South East, which received the highest proportion (39.5 per cent), was 8.7 percentage points this year.
This is bigger than the attainment gap between the highest and lowest performing regions when A-level exams were last held in 2019, which was 5.3 percentage points.
In 2019 the region with the lowest proportion of A* and As was the West Midlands (22 per cent) and the region with the highest was the South East (28.3 per cent).
The publication of figures showing a widening regional gap in top grades since 2019 follows concerns that schools in areas harder hit by Covid disruption could see a bigger impact on their results.
Early research into the impact of the pandemic on learning loss revealed a regional disparity back in October 2021.
This Department for Education research showed that parts of the North were hardest hit in both reading and maths.
Regional learning loss had previously been considered as a reason to adjust exam grading for GCSEs and A levels by area in late 2020, although this was later ruled out.
Responding to the disparities in today’s results, Kevin Phillips, responsible officer for exam board AQA, said: “We need to wait for the equalities analysis later in the year in order to be able to fully respond to that, but it is important to note that the package of support that was put in to reflect the impact on the 2022 cohort was available to all students.
“Of course, if there were any individual cases, those could be dealt with through the special consideration route.”
Figures published today give a breakdown of the proportion of A-level exams graded at A* or A in each government region of England.
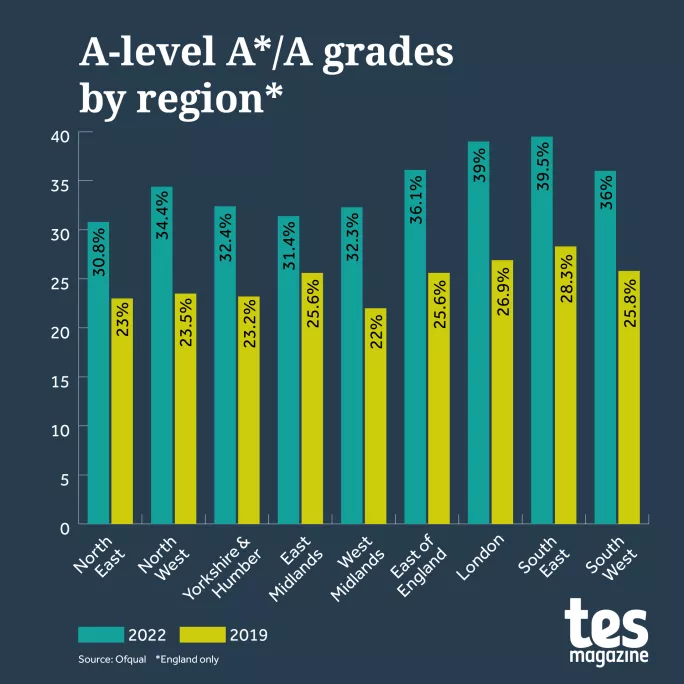
This shows that the South East saw the highest proportion of top grades, followed by London, where 39 per cent of exams were graded as an A* or A. The East of England and the South West also scored highly (36.1 and 36 per cent respectively).
This year follows a similar pattern to last year’s regional disparities, when teacher-assessed grades were used. London (47.9 per cent), the South West (47.7 per cent) and the South East (47.1 per cent) received the highest proportion of A* and A grades in 2021.
Last year there was an 8.7 percentage point gap between the highest performing region for top grades at A level, London, and the lowest performing, the North East.
Across the country, the proportion of top A-level grades has fallen compared with 2021, when teacher-assessed grades were used to produce A-level results following the cancellation of exams during the Covid pandemic.
The proportion of top-graded A levels fell by 8.4 percentage points this year in the North East compared with 2021, and by 7.6 percentage points in the South East.
Ofqual have also released more detailed data for regional variations in A* and A grades across the country.
The percentage of grades that were A and above on average across the country was 35.9 per cent this year.
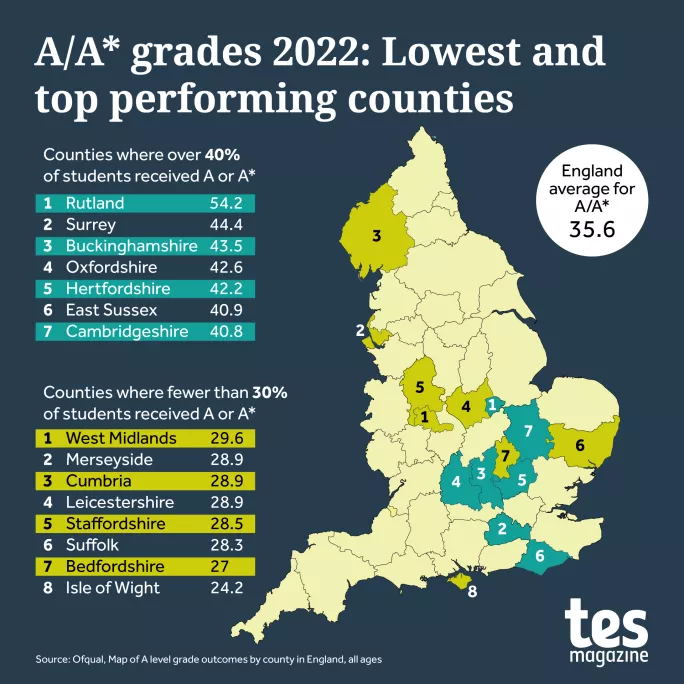
The counties where more than 40 per cent of grades awarded were A or above were Rutland (54.2 per cent), Surrey (44.4 per cent), Buckinghamshire (43.5 per cent) and Oxfordshire (42.6 per cent).
Other regions achieving over the 40 per cent mark were Hertfordshire, East Sussex and Cambridgeshire, which scored 42.2 per cent, 40.9 per cent and 40.8 per cent respectively.
The counties that had the lowest proportion of top grades were the Isle of Wight and Bedfordshire, which received 24.2 per cent and 27 per cent respectively.
Other counties that scored far below the national average were Leicestershire, Merseyside and Cumbria, where the percentage of grades at A or above achieved was 28.9 per cent.
In the West Midlands, 29.6 per cent of grades were A or above; in Suffolk, the figure was 28.3 per cent and in Staffordshire, it was 28.5 per cent.