


Recent
Most read

Earlier this month the Department for Education released its latest data on the A-level results, providing schools and educationalists with more detail on the performance of students in the summer 2022 exams.
The most striking thing about the data is it clearly shows that the disadvantage gap is the widest on record.
However, behind this headline are a raft of other insights that those in education, from classroom teachers to headteachers and academy trust CEOs, should be aware of. Here are some of the key trends you need to know about:
1. Top grades in Stem outnumber those in the arts
One of the notable takeaways from the data is that the trend of more As and A*s being awarded to science, technology, engineering and maths (Stem) subjects, compared with the arts, continues.
The rising popularity of Stem subjects (biology, chemistry, physics, maths, further maths and computing) has been well-publicised, and public money has been poured into campaigns to encourage young people to take these subjects through to A level.
These campaigns seem to be working. The DfE compares 2022 with 2019, rather than 2021 (when teacher-assessed grades were awarded because of the pandemic), and describes the uptick in Stem top grades as a “large increase”. It picks out further maths as experiencing the largest increase in A*s awarded (15.7 percentage points), and biology as receiving the smallest increase (6.3 percentage points), among Stem subjects.
Overall, the DfE table tells us that, on average, the A*s awarded across all Stem subjects have increased by 7.3 percentage points.
Arts subjects have not experienced the same level of increase. English language, for example, has only had an A* increase of 4.5 percentage points compared with 2019. And other subjects such as law (3.7 percentage points) and sociology (3.7 percentage points) received tiny uplifts in comparison.
In fact, when we look at the overall number of students achieving the top grades in Stem versus the arts, we see subjects like further maths and maths dominating (with 40 per cent and 22 per cent respectively) over subjects such as English language (6 per cent) and media studies (5.5 per cent).
So how can we account for this massive difference in the awarding of top grades?
Statistician and education analyst Dave Thomson, from FFT Education Datalab, says the difference is due to the students who are selecting to take these subjects in the first place.
“The higher number of A*s in Stem subjects is related to prior attainment,” he explains. “Pupils who do maths tend to have higher levels of prior (key stage 4) attainment, and, consequently, go on to secure higher grades.”
Thomson makes the point that, given that almost 100 per cent of further maths A-level students already scored a grade 7 in maths GCSE, the higher rate of A*s is to be expected. More able students are more likely to secure top grades.
Meanwhile, Barbara Bleiman, from the English Media Centre, says the smaller percentage of top grades being awarded in English is not an issue that she hears teachers or students talking about. It does, however, reflect a wider concern that young people have about continuing to study English.
“Although I’m not sure that English teachers, or students, are very aware of this discrepancy, it’s true that results are an issue for students,” she says. “This is because of concerns about predictably and certainty.”
Bleiman says she has been told that students are “put off” studying English after GCSE because of their perception that in English there are not “clear-cut right or wrong answers” and therefore results are “more worryingly unpredictable”.
This may also explain why English literature dropped out of the top 10 most popular subjects at A level in 2022.
Dr Rachel Roberts is the chair of the National Association for the Teaching of English (NATE) and also associate professor of English education at the University of Reading. She conducted interviews as part of research into attitudes towards studying English at A level and beyond, and found that English wasn’t perceived as ‘important’ as Stem subjects.
“A core reason for those choosing to do other subjects than English at A level (and beyond) was the emphasis that they felt their school (and society more generally) put on Stem,” says Roberts.
The grade data only seems to give more weight to this perception, and it will be of concern to English teachers and department heads around the country.
2. Type of institution
Although A-level grades fell in 2022, across all institutions, due to the “two-step climbdown” from the grade inflation we experienced with teacher-assessed grades in 2021, we can still compare the difference in the A-level average point score (APS) between different types of institution.
The DfE data shows that sixth-form colleges had the smallest decrease this year, with a fall of 1.3 points. Their average grade dropped from a B in 2021 to a B- this summer.
However, they were also the only type of institution to see an increase in the proportion of A*s awarded in 2022 compared with 2021 - rising from 12.5 to 12.6 per cent.
The overall APS for sixth-form colleges of 38.12 is broadly in line with the first pandemic uplift year of 2020 (38.21) but still someway ahead of the last non-affected year, 2019 (33.57).
Meanwhile, DfE data shows that sponsored mainstream academies saw a more significant fall of two-thirds of a grade, from a B to a C+, as their APS fell from 38.53 to 33.94. Some 9 per cent of students achieved A*.
Local authority mainstream schools also declined, although by a little less, falling from B to B- as the APS fell by around 3 points.
The highest APS within the state sector was for free schools for ages 16 to 19, with an average grade of B and an APS of 39.91. Some 17.6 per cent of entries achieved A*.
All of these were behind the independent sector, where the APS was 45.46 - a decline from 49.35 the year before. Some 27.3 per cent of entries received an A*.
3. The widening disadvantage gap
As anticipated following the events of the pandemic, the attainment gap between the poorest students and their wealthier peers widened.
In fact, the DfE acknowledges that it is the most severe disadvantage gap ever recorded. “[A]cross all exam cohorts, the disadvantage gap is at its widest point since the measure was introduced in 2016-17,” it says.
Within this disadvantage data, however, there are some interesting trends emerging that school leaders should take note of.
First of all, disadvantaged students continue to be underrepresented at A level.
This data can be found in the introduction to the “A-level and other 16-18 qualifications” release under the heading “Students and results reported in these statistics” and then under the subheading “Disadvantage”.
Here we discover that although 23.6 per cent of state-funded students, at the end of 16 to 18 study, were recorded as having disadvantaged status in 2021-22, only 14.3 per cent of the A-level cohort were identified as having disadvantaged status.
This means that in an A-level cohort of 100, you have nine missing disadvantaged students whose data is “lost” in the comparison.
And this appears to be an A-level specific problem, with disadvantage representation in every other qualification “generally in line” with the 23.6 per cent.
When looking back at previous years, there is very little variation in these numbers, suggesting that the problem has stagnated.
Carl Cullinane, director of research and policy at the Sutton Trust charity, which aims to improve social mobility and address educational disadvantage, says data on disadvantaged students could be more significant than the numbers suggest.
”[Because] fewer disadvantaged students go on to do A levels than their better-off peers, this has an impact on attainment gap data at post-16...the attainment gap looks lower than reality because it’s mostly the academically stronger disadvantaged young people who do A levels,” he says.
4. Choice in vocational qualifications
Given the CV of our new education secretary, Gillian Keegan, it is fair to assume that vocational qualifications will become a prominent focus in 2023.
Keegan herself was an apprentice, and when she was FE minister she was involved in the T-level rollout.
She will no doubt find it interesting that there has been a striking 38 per cent increase in the number of 16- to 18-year-olds taking vocational qualifications in 2021-22, compared with the year before - including both T levels and Btecs.
However, we don’t know the split between T levels and Btecs specifically, which is important because at present the government plans to cut funding for 150 level 3 qualifications, including 38 Btecs, that are taken by 66,000 students, over the next two years.
James Kewin, deputy chief executive of the Sixth Form Colleges Association (SFCA), says that, given this increase in the number of students taking vocational qualifications, the government’s plan is “baffling”. Many of these courses are “popular with students, valued by universities and respected by employers”, he adds.
Kewin says that if these courses are removed, the desire for more vocational courses will decline.
“The Department for Education would like to see T levels replace Btecss but that is simply not realistic,” he says.
“They are different qualifications that have a different purpose. Scrapping Btecs is a guaranteed way to reverse the recent progress made in student participation and performance.”
To try and stop this, the SFCA was one of 29 organisations, alongside the likes of the Association of School and College Leaders, the NEU teaching union and the UCU union, that wrote to the education secretary this week, as part of the Protect Student Choice: Don’t Scrap Btecs campaign, urging her to rethink the government’s plan.
Cullinane agrees there is an issue here because for many disadvantaged young people, Btecs are a clear choice over A levels, and it is important these students have a breadth of options before them.
“Ensuring that there is a wide range of high-quality vocational and technical qualifications available to all young people is also vital,” he adds.
Given all of this, it will be interesting to see if Keegan chooses to reverse any plans underway in this area.
5. Outcomes by first language
Another interesting insight from the DfE data relates to the first language of students.
While non-disadvantaged students with English as their first language performed better than students with a first language other than English (unsurprisingly), English-as-an-additional-language (EAL) students - both disadvantaged and non-disadvantaged - outperformed disadvantaged English-speaking students, as the below APS data shows:
This comes as no surprise to Ian Cushing, senior lecturer in English and education at Edge Hill University, who says EAL students should not be underestimated.
“Multilingual students arrive at school with cognitive, cultural and linguistic advantages over their monolingual peers,” he says.
“Yet education policy in England has historically framed these students - particularly those from low-income families - as deficient and in need of remediation, often through practices which seek to silence rather than sustain their multilingual repertoires.”
Cushing calls for a “radical reshift” in education policy in terms of its perception of low-income multilingual children’s language, from a “deficit to be fixed” to a “rich, cognitive resource”.
This view is shared by Diana Sutton, director of The Bell Foundation, an organisation that provides support to schools and other organisations working with people with EAL.
Sutton says that EAL speakers are a “hugely diverse group” that includes both “refugees fleeing war” and “children with multilingual, affluent parents”, and, as a consequence, “aggregated attainment figures for this group of learners can hide as much as they tell us”.
“Research evidence shows very clearly that it is EAL pupils’ proficiency in English which has the biggest impact on attainment,” she argues.
“[It is this that] explains [how you can find] as much as 22 per cent of the variation in EAL pupils’ achievement compared to the typical 3 to 4 per cent that can be statistically explained by gender, free school meal status and ethnicity.”
For school leader Vince Green, CEO of Summit Learning Trust, where 40 per cent of their learners have EAL, the news is “not surprising”.
He says that the national picture matches the results of EAL learners in his trust, something he puts down to “the high levels of support they receive and their dedication in overcoming language barriers to achieve highly”.
Green also makes the point that, although this is good news for EAL students, it emphasises that the attention must also go to those students who aren’t achieving as highly.
“These findings also highlight that our sector needs to continue to prioritise work, supported by research, to significantly raise the academic progress levels of all underachieving groups, particularly all of those deemed to be disadvantaged,” he says.
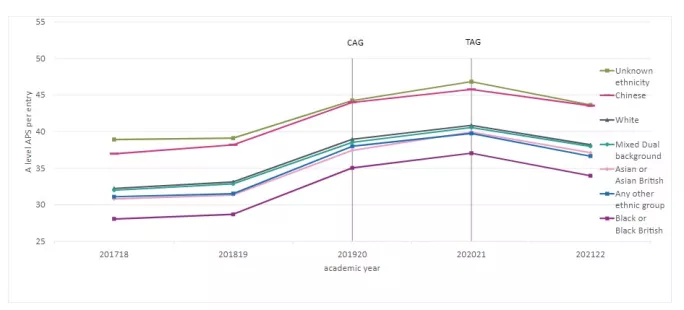
6. Outcomes by ethnicity
Results are also broken down by ethnicity to identify patterns and see if particular groups are disproportionately underperforming.
The DfE data shows that Chinese students continue to score the highest grades of the ethnicities measured, with an APS of 43.55 - from a small cohort of 1,580 students.
Students classed as white, meanwhile, have an average APS of 38.21 from a cohort of 167,669.
Asian or Asian British students scored an APS of 37.11 from a cohort total of 35,166, while black or black British students achieved an APS of 33.98 from a cohort total of 15,435.
The final two groups in this tier of classification from the DfE are mixed dual background (APS: 37.99 from 13,604 students) and unknown ethnicity - which actually has the highest APS of all groups, at 43.65 from 45,782 students. This likely includes many students from the independent sector where ethnicity is rarely recorded.
These trends have stayed almost uniform thorough the pandemic.
Source: DfE - A level and other 16 to 18 results, Academic Year 2021-22
However, Professor Alice Sullivan, a sociologist and head of research at the UCL Social Research Institute, says the DfE presenting the data like this is less than ideal.
“This grouping could mask variability between black students from groups with very different cultures and histories,” she explains.
It’s a point also made by Jan Balon, headteacher of London Academy of Excellence Tottenham.
“The use of broad categories such as ‘black’ can be extremely unhelpful in monitoring the progress and attainment of particular groups of students,” she says.
“In some cases it suggests issues where they don’t exist but, more worryingly and more often, these broad-brush categories hide the real differences in academic performance, the differences that schools on a local level should be in a position to understand best.”
The DfE data can be further segmented, and this changes the picture somewhat.
For example, within the black or black British data, there is actually an APS gap of 2.2 per cent between those classified as black or black British and those classified as black Caribbean, where an APS of 32.17 from 2,351 students is recorded. There is also a 2.2 per cent gap between black or black British and black African, where an average APS of 34.38 from 11,240 students is recorded.
There are also notable variations within the data for Asian or Asian British students:
Thomson says this more detailed data offers far more useful insights for schools if they decide to analyse cohort performance by ethnicity.
“Analysis using the more granular ethnic groups is always more revealing,” he says.
Grainne Hallahan is senior analyst at Tes