


Recent
Most read

Most schools achieve broadly the same outcomes for their students once social disadvantage is taken more fully into account, according to research.
The study looked at the progress of pupils in English state schools when scores are adjusted for a wider definition of social disadvantage than that used by either the current Progress 8 score, or the previous “contextual value added” measure, abandoned in 2010.
The new measure includes 10 factors of disadvantage including levels of deprivation and child poverty in the school’s area, the date when pupils first registered at an English state school, and pupils’ first language.
Dave Thomson, a chief statistician with FFT Education Datalab, concluded that, using his own model of Contextual Value Added (CVA), most schools’ attainment “isn’t that different” when social disadvantage is taken into account.
Related: ‘Flawed Progress 8 is costing school leaders their jobs’
Quick-read: ‘Progress 8 is biased and fundamentally flawed’
Opinion: ‘Why won’t Ofsted admit that pupil background can hinder schools?’
Arranging the CVA of every school from lowest to highest, using GCSE and BTEC scores to calculate attainment based on pupils’ prior key stage 2 scores, he found that “while there are some outliers with extremely high or low scores” - some of which were small schools with “unreliable” data - 90 per cent of schools were bunched together, suggesting most schools have similar levels of attainment once their pupils’ different levels of social disadvantage is taken into account.
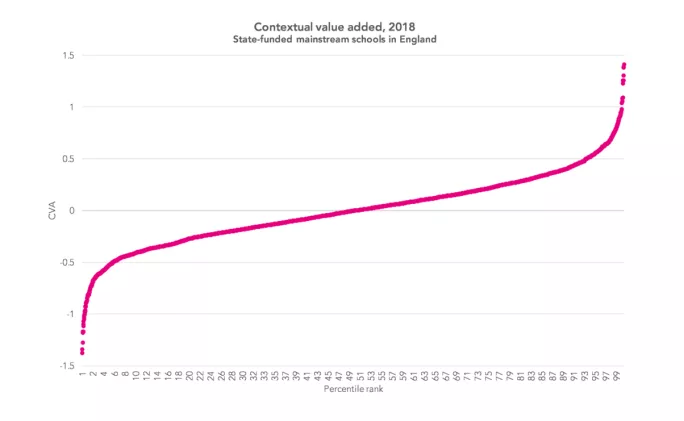
In a blog post on the subject, Mr Thomson noted that, for Progress 8, the comparable proportion of schools falling within the same range of attainment was 73 per cent.
He said that, while differences between the lowest-performing and highest-performing schools were still significant, once CVA was accounted for, the variations in progress between most schools was “not so great”.
CVA scores were published by the Department of Education until 2010, when the Coalition government scrapped them, stating in a White Paper that it was “morally wrong to have an attainment measure which entrenches low aspirations for children because of their background”.
Noting that Progress 8 has been criticised for bias towards middle-class intakes, Mr Thomson said that Progress 8 was fairer than some other measures of attainment, as it addresses the impact of pupils’ prior attainment before starting secondary school.
“But it stops short of being fair with regard to other factors known to have an effect on attainment, particularly disadvantage,” he wrote.
He also described CVA as “useless for ranking schools in order of effectiveness from best to worst”.
However, he added: “If we are going to compare schools, it’s the fairest way of doing it.
“Ultimately, it shows that attainment in most schools isn’t that different. Perhaps this is the real reason it was abandoned.”