


Recent
Most read

The attainment gap between poorer pupils and their peers has widened at GCSE for the second year in a row, new data has revealed today.
The gap at GCSE is based on average grades achieved in English and maths GCSE. A disadvantage gap of 0 would mean that poorer pupils performed as well as their advantaged peers.
Related: Academy chains below average on Progress 8 and EBacc
Performance tables: EBacc entry rate reaches peak of 40%
News: Disadvantage gap ‘could close if schools work together’
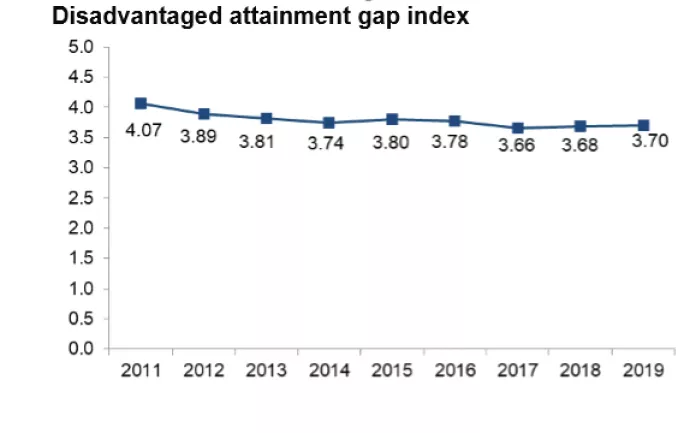
Data released today shows the disadvantage gap has widened for the second year to 3.70. In 2018, the gap was 3.68 and in 2017 it was 3.66. This means the gap has widened year-on-year since the advent of Michael Gove’s reformed GCSE qualifications.
In summer 2017, the first of the reformed GCSEs - designed to be more rigorous than the legacy qualifications - were sat in English language, English literature and mathematics.
Since 2017, the gap has widened by 0.4 per cent. However, the disadvantage gap is still 9.1 per cent lower than it was in 2011.
Gaps in the proportions of disadvantaged and advantaged students being entered for, and achieving, the English Baccalaureate (EBacc) as well as attainment over eight GCSE grades have also widened, the DfE data shows.
The EBacc is a measure that recognises pupils who take a suite of core academic GCSEs - English, maths, science, history or geography and a foreign language.
The latest data shows that just over a quarter (27.5 per cent) of disadvantaged teenagers were entered for all of the EBacc subjects last year, compared to 44.5 per cent of all other students - a gap of 17 percentage points.
In 2018, the gap was 16.4 percentage points (26.4 versus 42.8 per cent).
In addition, the statistics show that the EBacc average points score for pupils from poorer homes was 3.08, compared to 4.43 for those from wealthier backgrounds - a difference of 1.35. In 2018, the difference was 1.33.
The DfE’s figures also look at attainment in eight GCSE-level qualifications. These show that disadvantaged pupils had an Attainment 8 score of 36.7, compared with 50.3 for advantaged students - a gap of 13.6.
In 2018, the gap was 13.4. Pupils are considered to be disadvantaged if they have been eligible for free school meals between Year 6 (the final year of primary school) and Year 11, if they have been looked after, or if they are recorded as being adopted from care.
In 2019, around one in four (26.5 per cent) pupils in state schools in England at the end of Year 11 were considered disadvantaged.
Schools minister Nick Gibb said: “The attainment gap between disadvantaged children and their peers remains stable and is down by around 9 per cent since 2011 - but we recognise there is more to do.”
Duncan Baldwin, deputy policy director at the Association of School and College Leaders, said: “Some groups of disadvantaged pupils make less progress than others because of challenges in their lives, and this can penalise schools with more disadvantaged pupils.”