Venn diagramQuick View
bagibagi

Venn diagram

(0)
A visual introduction to the intersection and union of Venn Diagrams Whole or part of a lesson. Included: **
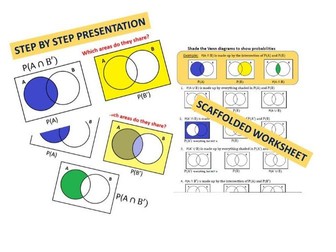
PowerPoint presentation: ** A step by step animated presentation to show how you can find union and intersection of areas using two circles. Example: P(A ∩B′) is made out of the shared area of A and B’. You can use it for an introduction or recap either as a class discussion or using mini whiteboards. Wokrsheet (editable PowerPoint and PDF for printing): Follows the slides of the PowerPoint, students shade in the Venn Diagrams simultaneously with the presentation or afterwards. A blank Venn diagram sheet is also included for your own questions.
Percentage of amount RAGQuick View
bagibagi

Percentage of amount RAG

(0)
Worksheets practising percentages from basics to challenging ones What’s included RAG worksheets - 4 difficulty levels: basic, medium, harder, challenge (Word or PDF ANSWERS (Word or PDF ** EXCEL editable workbook** with all the above, plus a blank page (Your Q) where you can enter your own percentages and originals. The answers will appear on the “Your A” page .Save a separate copy before editting.
Percentage of amountQuick View
bagibagi

Percentage of amount

(0)
Interactive resource : Percentage trees Can be used as part or whole lesson Students can make a connection between simple percentages, eg. 20% is double of 10%, 15% is half of 30%. Questions can be differentiated by choosing easier or harder numbers. What’s included: 1, PowerPoint for whole class discussion (Percentage trees)- you can go through the percentages step by step first just with the percentages, then with an example. Last 2 slides are for printing double sided, can be also cut up. 2, Excel - 2 pages: questions and answers. You can put your own number in the middle box and on the answer page all the solutions will appear. Differentiation by choosing easier/harder numbers, including decimals It’s advisable to save a copy when making changes. 3, PDF - blank worksheet, 3 on each page, can be printed single or double sided. 4, PowerPoint for printing (percentage trees - double sided) - 4 x A5 sheets (2 on each A4 page)
Translation vector starterQuick View
bagibagi

Translation vector starter

(1)
2 types of questions: 1, vector given, write in words 2, words give, write the vector Click to reveal answers. Can be a starter of practice activity Tip: Discuss what the top numbers represent (left or right) and the bottom numbers (up or down). What does the +/- mean with the top and the bottom number.
Solving linear equationsQuick View
bagibagi

Solving linear equations

(3)
One presentation shows 2 different ways of solving the same linear equation, one with a flowchart and the other with balancing. On the second presentation 2 equations are displayed, solving by balancing method step by step.
Trigonometry introductionQuick View
bagibagi

Trigonometry introduction

(1)
Introduce your students into trigonometry by studying the relationship between the sides of similar triangles. The PowerPoint corresponds with the printable table and you can go through answers with them at your own pace by clicking on answers. Students should notice that eg. O/H is always 0.8666. On slide 3 you can introduce sin, cos and tan 30 and ask them to check on their calculators. What’s included: Powerpoint: Table to fill, answers, exllanation about labelling the sides and Soh CAH TOA. PDF: printable A4 sheet (2 A5 tables on each page, can be stuck in books).
Sketching quadratic graphs demonstrationQuick View
bagibagi

Sketching quadratic graphs demonstration

(0)
A brief PowerPoint demonstration about how we can derive the critical points of a quadratic equation from its different forms to sketch its graphs. Complete the square - turning point (vertex) Factorising - roots/solutions (where the graph crosses the x-axis Expanded form - y intercept (where the graph crosses the y axis Previous knowledge required: completing the square factorising double brackets solving quadratic equation from factorising translation of quadratic graphs
Matrix multiplication dimensionsQuick View
bagibagi

Matrix multiplication dimensions

(0)
A Powerpoint showing the dimensions of the matrix resulting when matrices are multiplied. This resource assumes students already know how to multiply matrices. It can be used for a whole class, for a whole or part of a lesson. 2 slides. 1st slide: a few examples given of matrix multiplication and answers. You can display the questions first for students to work out, then click for the answer or providing your students are fluent with matrix multiplication, you can go through the examples more quickly and concentrate on the matrix dimensions. 2nd slide: draws attention to pattern. 4 practice questions on dimension with answers given.
Compound interest table worksheetQuick View
bagibagi

Compound interest table worksheet

(0)
A printable worksheet on compound interest, including depreciation, answers are on the second sheet. Scaffolding is gradually taken away, helping students to solve the problem independently. You can also generate other worksheets by changing the amount in the first year and the multiplier, all the answers will change.
Multiplication grid methodQuick View
bagibagi

Multiplication grid method

(0)
Interactive Excel wokrsheet, where you can put your numbers in the boxes and the answers will show with the workings on another page. There are 6 workbooks, Question and answers for 2 by 2 and 3 by 3 as well as 2 blank grids. I suggest you save a separate copy of this Excel workbook in case you accidentally alter the formulas. Practice sheet for 2 by 2 and 3 by 3 digit multiplication with an example, an editable Word and a PDF version. Can be printed double sided.
Matrix multiplication interactive toolQuick View
bagibagi

Matrix multiplication interactive tool

(0)
An interactive Excel workbook. Enter your numbers in the matrices and the answers will automatically show on the next page. Multiply a 2 by 2 with a 2 by 2 matrix or a 3 by 2 with a 2 by 3 matrix. You can use this in the classroom, display the first page as a question, allow students to work out the answers, then display the answer page. You can also use this for individual practice. Don’t type anything in the answer page. I recommend that you save a spare copy, in case you mess up the formulas.
Adding fractions demonstrationQuick View
bagibagi

Adding fractions demonstration

(0)
Demonstration of adding fractions with: - same denominator - one denominator goes into the other one - cross multiply - with LCM
Matrix rotation interactive toolQuick View
bagibagi

Matrix rotation interactive tool

(0)
An interactive Excel tool to rotate triangles using matrices. Basic rotations are given, just enter the coordinates of your points and it will calculate the images. You can also use any with any angle in the bottom of the page. Save a spare copy in case you mess up the formulas.