Unit 1 Topic 1 - Planning and Financing a Business. This is the first section of the Elementary Explanations, one of a set of six resources, written specifically for the new Business Specification by experienced examiners and teachers.
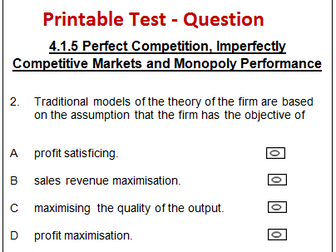
This is the 1st Set of 30 of 540 Printable Multiple Choice Questions for AQA A-Level Economics on Section 4.1.1 Economic Methodolgy and the Economic Problem.
This resource is one of 18 sets of 30 multiple choice questions to test students’ knowledge and understanding of the subject content required to be covered for AQA A-level Economics ie on Individuals, Firms, Markets and Market Failure and The National and International Economy. There is also an Interactive version available - for use on a computer for students to complete in their own time, or during class as a group exercise.
The full set of 540 questions contains a set of 30 questions on each of the 14 subject content areas listed in the AQA A-level Economics specification (published for teaching from September 2015), ie 30 multiple choice questions on each of the following numbered sections:
4.1 Individuals, firms, markets and market failure:
4.1.1 Economic methodology and the economic problem
4.1.2 Individual economic decision making
4.1.3 Price determination in a competitive market
4.1.4 Production, costs and revenue
4.1.5 Perfect competition, imperfectly competitive markets and monopoly
4.1.6 The labour market
4.1.7 The distribution of income and wealth: poverty and inequality
4.1.8 The market mechanism, market failure and government intervention in markets
4.2 The national and international economy:
4.2.1 The measurement of macroeconomic performance
4.2.2 How the macroeconomy works : the circular flow of income, AD/AS analysis, and related
concepts
4.2.3 Economic performance
4.2.4 Financial markets and monetary policy
4.2.5 Fiscal policy and supply-side policies
4.2.6 The international economy
The full set of 540 questions also contains:
2 ‘end of section’ tests, ie a set of 30 questions testing aspects relating to Individuals, Firms, Markets and Market Failure and a set of 30 questions testing aspects relating to The National and International Economy.
2 final tests of 30 questions on any aspect of the AQA A-level Economics specification. These could form part of a mock examination for A-level Paper 3: Economic Principles and Issues. These ‘final test’ papers reflect the specimen assessment material produced by AQA for this paper (at the time of writing), with the majority of the multiple choice questions assessing students’ knowledge and understanding, but a significant proportion of questions also testing their ability to apply their knowledge and understanding to various economic contexts to show how economic agents are affected by and respond to economic issues.
The resource, therefore, enables students to be tested at the end of each subject content area covered in class, as well as at the very end of their study of AQA A-level Economics.
Lesson PowerPoint Presentation for GCSE Statistics on Index Numbers (22 slides), written by a highly experienced teacher (of 25+ years), senior examiner and reviser for Maths and Stats examinations. It explains how to calculate use and interpret index numbers, chain base index numbers and weighted index numbers. It gives real-life examples where weighted indices are used. It explains RPI, inflation, CPI and GDP, as well as how to interpret an output gap chart. It includes:
Lesson objectives
Step-by-step explanations of the subject matter
Examples to aid understanding
Questions to check understanding
Answers to questions, with explanations
Suggestions regarding which topic(s) should be moved on to next.
It is 1 of a set of 14 Lesson PowerPoint Presentations on ‘Analysing Data’ that APT Initiatives has published for GCSE Statistics. The full set of set of 14 PowerPoints (238 slides excluding Title Pages) covers the following topics relating to ‘Analysing Data’:
01 Averages – Mode (19 slides).
02 Averages – Median (19 slides).
03 Averages – Mean (19 slides).
04 Other Means – Weighted & Geometric(12 slides).
05 Measures of Dispersion – Range (16 slides).
06 Measures of Dispersion – Interquartile Range (20 slides).
07 Cumulative Frequency (25 slides).
08 Box (and Whisker) Plots (11 slides).
09 Distributions, Variance & Standard Deviation (18 slides).
10 Skewness Coefficients (11 slides).
11 Time Series and Moving Averages (25 slides).
12 Crude and Standardised Rates (11 slides).
13 Index Numbers (22 slides).
14 Quality Assurance (10 slides).
These PowerPoints are one of 4 sets of PowerPoint Presentations that APT Initiatives Ltd has published to support teachers and students of GCSE Statistics. Other sets concern:
Collecting Data
Representing Data
Probability
The purchase of this resource comes with a licence to make the resource available in digital and / or in print form (including photocopying) to the staff and students attending the purchasing institution, ie the individual school / college on a single site. The resource may be distributed via a secure virtual learning environment. It must not be made available on any public or insecure website or other platform. The resource must not be distributed to other institutions that are members of the same academy chain or similar organisation; each individual institution must purchase their own copy of the resource.
PowerPoint Presentation on Other Means – Weighted & Geometric (12 slides): Explains how to find the weighted and geometric means of data. It has been written by a highly experienced teacher (of 25+ years), senior examiner and reviser for Maths and Stats examinations. It includes:
Lesson objectives
Step-by-step explanations of the subject matter
Examples to aid understanding
Questions to check understanding
Answers to questions, with explanations
Suggestions regarding which topic(s) should be moved on to next.
It is 1 of a set of 14 PowerPoint Presentations on ‘Analysing Data’ that APT Initiatives has published for GCSE Statistics. The content of this PowerPoint is also relevant to the ‘Statistics’ section of the GCSE Maths specifications and included in APT’s PowerPoints for GCSE Maths.
The full set of set of 14 PowerPoints (238 slides excluding Title Pages) covers the following topics relating to ‘Analysing Data’:
01 Averages – Mode (19 slides).
02 Averages – Median (19 slides).
03 Averages – Mean (19 slides).
04 Other Means – Weighted & Geometric(12 slides).
05 Measures of Dispersion – Range (16 slides).
06 Measures of Dispersion – Interquartile Range (20 slides).
07 Cumulative Frequency (25 slides).
08 Box (and Whisker) Plots (11 slides).
09 Distributions, Variance & Standard Deviation (18 slides).
10 Skewness Coefficients (11 slides).
11 Time Series and Moving Averages (25 slides).
12 Crude and Standardised Rates (11 slides).
13 Index Numbers (22 slides).
14 Quality Assurance (10 slides).
These PowerPoints are one of 4 sets of PowerPoint Presentations that APT Initiatives Ltd has published to support teachers and students of GCSE Statistics. Other sets concern:
Collecting Data
Representing Data
Probability
The purchase of this resource comes with a licence to make the resource available in digital and / or in print form (including photocopying) to the staff and students attending the purchasing institution, ie the individual school / college on a single site. The resource may be distributed via a secure virtual learning environment. It must not be made available on any public or insecure website or other platform. The resource must not be distributed to other institutions that are members of the same academy chain or similar organisation; each individual institution must purchase their own copy of the resource
PowerPoint Presentation on Population Pyramids and Choropleth Maps (15 slides): Explains how to use and interpret population pyramids and how to produce and interpret choropleth maps. It has been written by a highly experienced teacher (of 25+ years), senior examiner and reviser for Maths and Stats examinations. It includes:
Lesson objectives
Step-by-step explanations of the subject matter
Examples to aid understanding
Questions to check understanding
Answers to questions, with explanations
Suggestions regarding which topic(s) should be moved on to next.
It is 1 of a set of 13 PowerPoint Presentations on ‘Representing Data’ that APT Initiatives has published for GCSE Statistics. The full set of set of 13 PowerPoints (225 slides excluding Title Pages) covers the following topics for GCSE Statistics on ‘Representing Data’:
01 Block Diagrams and Dot Plots (12 slides).
02 Pictograms (16 slides).
03 Bar Charts, Bar Line Graphs and Frequency Diagrams – Polygons (26 slides).
04 Population Pyramids and Choropleth Maps (15 slides).
05 Line Graphs (9 slides).
06 Stepped Tables and Two-way Tables (18 slides).
07 Pie Charts (18 slides): Explains how to draw and interpret pie charts.
08 Comparative Pie Charts (10 slides).
09 Scatter Diagrams (40 slides).
10 Correlation Coefficients (11 slides).
11 Stem and Leaf Diagrams (17 slides).
12 Histograms (14 slides).
13 Misleading Graphs and other Data Representations (19 slides).
This set of PowerPoints are one of 4 sets of PowerPoint Presentations that APT Initiatives Ltd has published to support teachers and students of GCSE Statistics. Other sets concern:
Collecting Data
Analysing Data
Probability
The purchase of this resource comes with a licence to make the resource available in digital and / or in print form (including photocopying) to the staff and students attending the purchasing institution, ie the individual school / college on a single site. The resource may be distributed via a secure virtual learning environment. It must not be made available on any public or insecure website or other platform. The resource must not be distributed to other institutions that are members of the same academy chain or similar organisation; each individual institution must purchase their own copy of the resource.
PowerPoint Presentation on Comparative Pie Charts (10 slides): Revises the equation for the area of a circle and finding fractions of amounts, before explaining how to draw and interpret comparative pie charts. It has been written by a highly experienced teacher (of 25+ years), senior examiner and reviser for Maths and Stats examinations. It includes:
Lesson objectives
Step-by-step explanations of the subject matter
Examples to aid understanding
Questions to check understanding
Answers to questions, with explanations
Suggestions regarding which topic(s) should be moved on to next.
It is 1 of a set of 13 PowerPoint Presentations on ‘Representing Data’ that APT Initiatives has published for GCSE Statistics. The full set of set of PowerPoints (225 slides excluding Title Pages) covers the following topics on ‘Representing Data’:
01 Block Diagrams and Dot Plots (12 slides).
02 Pictograms (16 slides).
03 Bar Charts, Bar Line Graphs and Frequency Diagrams – Polygons (26 slides).
04 Population Pyramids and Choropleth Maps (15 slides).
05 Line Graphs (9 slides).
06 Stepped Tables and Two-way Tables (18 slides).
07 Pie Charts (18 slides): Explains how to draw and interpret pie charts.
08 Comparative Pie Charts (10 slides).
09 Scatter Diagrams (40 slides).
10 Correlation Coefficients (11 slides).
11 Stem and Leaf Diagrams (17 slides).
12 Histograms (14 slides).
13 Misleading Graphs and other Data Representations (19 slides).
This set of PowerPoints are one of 4 sets of PowerPoint Presentations that APT Initiatives Ltd has published to support teachers and students of GCSE Statistics. Other sets concern:
Collecting Data
Analysing Data
Probability
The purchase of this resource comes with a licence to make the resource available in digital and / or in print form (including photocopying) to the staff and students attending the purchasing institution, ie the individual school / college on a single site. The resource may be distributed via a secure virtual learning environment. It must not be made available on any public or insecure website or other platform. The resource must not be distributed to other institutions that are members of the same academy chain or similar organisation; each individual institution must purchase their own copy of the resource.
A Practice (Mock) Exam Paper for AQA A-level Economics Paper 2 on the National & International Economy, including mark schemes with detailed example answers, written by a senior examiner for multiple examination boards and experienced teacher of AS & A-level Economics. To assess the quality of our papers for AQA A-level Economics a full Paper (for Paper 1 on Markets & Market Failure) is available to download FREE from here: https://www.tes.com/teaching-resource/resource-12154686
This particular paper is the first of 4 Practice (Mock) Exam Papers APT Initiatives Ltd has published for AQA A-level Economics Paper 2 on the National & International Economy. The full set of 4 question papers have been written to include questions that test as many areas listed in the specification subject content relating to Section 4.2 as possible.
Question papers, mark schemes and answers have been written taking into account the specimen assessment material (SAM) for A-level Paper 2 published by AQA for the launch of the new A-level Economics specification (from 2015). The structure, style and format of question papers and mark schemes are in line with this SAM, with a few minor differences / additions considered beneficial for teachers and their students.
For questions carrying high marks, the detailed example answers provided:
are written in paragraph form.
contain a range of comments that attract a mark.
include annotations that show where individual assessment objectives (ie Knowledge, Application, Analysis and Evaluation) have been demonstrated.
These Practice (Mock) Exam Papers are one of several resources published by APT Initiatives Ltd to support teachers and students taking AQA AS and A-level Economics. Multiple Choice questions (interactive and printable tests) have been produced for AS Paper 1 and AS Paper 2, as well as for the entire AQA A-level specification, and Practice (Mock) Exam Papers have also been produced for Paper 1 (on Section 4.1 of the A-level Specification) and Paper 3 (on the entire A-level Specification).
A Practice (Mock) Exam Paper for AQA A-level Economics Paper 3 on Economic Principles and Issues, including mark schemes with detailed example model answers, written by a senior examiner for multiple examination boards and experienced teacher of AS & A-level Economics. To assess the quality of our papers for AQA A-level Economics a full Paper (for Paper 1 on Markets & Market Failure) is available to download FREE from here: https://www.tes.com/teaching-resource/resource-12154686
This particular paper is the third of 4 Practice (Mock) Exam Papers APT Initiatives Ltd has published for AQA A-level Economics Paper 3 on Economic Principles and Issues. The full set of 4 question papers have been written to include questions that test as many areas listed in the specification subject content as possible.
Question papers, mark schemes and answers have been written taking into account the specimen assessment material (SAM) for A-level Paper 3 published by AQA for the launch of the new A-level Economics specification (from 2015). The structure, style and format of question papers and mark schemes are in line with this SAM, with a few minor differences / additions considered beneficial for teachers and their students.
For questions carrying high marks, the detailed example answers provided:
are written in paragraph form.
contain a range of comments that attract a mark.
include annotations that show where individual assessment objectives (ie Knowledge, Application, Analysis and Evaluation) have been demonstrated.
These Practice (Mock) Exam Papers are one of several resources published by APT Initiatives Ltd to support teachers and students taking AQA AS and A-level Economics. Multiple Choice questions (interactive and printable tests) have been produced for AS Paper 1 and AS Paper 2, as well as for the entire AQA A-level specification, and Practice (Mock) Exam Papers have also been produced for Paper 1 (on Section 4.1 of the A-level Specification) and Paper 2 (on Section 4.2).
A Practice (Mock) Exam Paper for AQA A-level Economics Paper 1 on Makets & Market Failure, including mark schemes with detailed example answers, written by a senior examiner for multiple examination boards and experienced teacher of AS & A-level Economics. To assess the quality of our papers for AQA A-level Economics a full paper is available to download FREE from here: https://www.tes.com/teaching-resource/resource-12154686
This particular paper is the final of 4 Practice (Mock) Exam Papers APT Initiatives Ltd has published for AQA A-level Economics Paper 1 on Makets & Market Failure. The full set of 4 question papers have been written to include questions that test as many areas listed in the specification subject content relating to Section 4.1 as possible.
Question papers, mark schemes and answers have been written taking into account the specimen assessment material (SAM) for A-level Paper 1 published by AQA for the launch of the new A-level Economics specification (from 2015). The structure, style and format of question papers and mark schemes are in line with this SAM, with a few minor differences / additions considered beneficial for teachers and their students.
For questions carrying high marks, the detailed example answers provided:
are written in paragraph form.
contain a range of comments that attract a mark.
include annotations that show where individual assessment objectives (ie Knowledge, Application, Analysis and Evaluation) have been demonstrated.
These Practice (Mock) Exam Papers are one of several resources published by APT Initiatives Ltd to support teachers and students taking AQA AS and A-level Economics. Multiple Choice questions (interactive and printable tests) have been produced for AS Paper 1 and AS Paper 2, as well as for the entire AQA A-level specification, and Practice (Mock) Exam Papers have also been produced for Paper 2 (on Section 4.2 of the A-level Specification) and Paper 3 (on the entire A-level Specification).
A Practice (Mock) Exam Paper for AQA A-level Economics Paper 1 on Makets & Market Failure, including mark schemes with detailed example answers, written by a senior examiner for multiple examination boards and experienced teacher of AS & A-level Economics. To assess the quality of our papers for AQA A-level Economics a full paper is available to download FREE from here: https://www.tes.com/teaching-resource/resource-12154686
This particular paper is the second of 4 Practice (Mock) Exam Papers APT Initiatives Ltd has published for AQA A-level Economics Paper 1 on Makets & Market Failure. The full set of 4 question papers have been written to include questions that test as many areas listed in the specification subject content relating to Section 4.1 as possible.
Question papers, mark schemes and answers have been written taking into account the specimen assessment material (SAM) for A-level Paper 1 published by AQA for the launch of the new A-level Economics specification (from 2015). The structure, style and format of question papers and mark schemes are in line with this SAM, with a few minor differences / additions considered beneficial for teachers and their students.
For questions carrying high marks, the detailed example answers provided:
are written in paragraph form.
contain a range of comments that attract a mark.
include annotations that show where individual assessment objectives (ie Knowledge, Application, Analysis and Evaluation) have been demonstrated.
These Practice (Mock) Exam Papers are one of several resources published by APT Initiatives Ltd to support teachers and students taking AQA AS and A-level Economics. Multiple Choice questions (interactive and printable tests) have been produced for AS Paper 1 and AS Paper 2, as well as for the entire AQA A-level specification, and Practice (Mock) Exam Papers have also been produced for Paper 2 (on Section 4.2 of the A-level Specification) and Paper 3 (on the entire A-level Specification).
A Practice (Mock) Exam Paper for AQA A-level Economics Paper 1 on Makets & Market Failure, including mark schemes with detailed example answers, written by a senior examiner for multiple examination boards and experienced teacher of AS & A-level Economics. To assess the quality of our papers for AQA A-level Economics a full paper is available to download FREE from here: https://www.tes.com/teaching-resource/resource-12154686
This particular paper is the third of 4 Practice (Mock) Exam Papers APT Initiatives Ltd has published for AQA A-level Economics Paper 1 on Makets & Market Failure. The full set of 4 question papers have been written to include questions that test as many areas listed in the specification subject content relating to Section 4.1 as possible.
Question papers, mark schemes and answers have been written taking into account the specimen assessment material (SAM) for A-level Paper 1 published by AQA for the launch of the new A-level Economics specification (from 2015). The structure, style and format of question papers and mark schemes are in line with this SAM, with a few minor differences / additions considered beneficial for teachers and their students.
For questions carrying high marks, the detailed example answers provided:
are written in paragraph form.
contain a range of comments that attract a mark.
include annotations that show where individual assessment objectives (ie Knowledge, Application, Analysis and Evaluation) have been demonstrated.
These Practice (Mock) Exam Papers are one of several resources published by APT Initiatives Ltd to support teachers and students taking AQA AS and A-level Economics. Multiple Choice questions (interactive and printable tests) have been produced for AS Paper 1 and AS Paper 2, as well as for the entire AQA A-level specification, and Practice (Mock) Exam Papers have also been produced for Paper 2 (on Section 4.2 of the A-level Specification) and Paper 3 (on the entire A-level Specification).
A Practice (Mock) Exam Paper for AQA A-level Economics Paper 2 on the National & International Economy, including mark schemes with detailed example answers, written by a senior examiner for multiple examination boards and experienced teacher of AS & A-level Economics. To assess the quality of our papers for AQA A-level Economics a full Paper (for Paper 1 on Markets & Market Failure) is available to download FREE from here: https://www.tes.com/teaching-resource/resource-12154686
This particular paper is the second of 4 Practice (Mock) Exam Papers APT Initiatives Ltd has published for AQA A-level Economics Paper 2 on the National & International Economy. The full set of 4 question papers have been written to include questions that test as many areas listed in the specification subject content relating to Section 4.2 as possible.
Question papers, mark schemes and answers have been written taking into account the specimen assessment material (SAM) for A-level Paper 2 published by AQA for the launch of the new A-level Economics specification (from 2015). The structure, style and format of question papers and mark schemes are in line with this SAM, with a few minor differences / additions considered beneficial for teachers and their students.
For questions carrying high marks, the detailed example answers provided:
are written in paragraph form.
contain a range of comments that attract a mark.
include annotations that show where individual assessment objectives (ie Knowledge, Application, Analysis and Evaluation) have been demonstrated.
These Practice (Mock) Exam Papers are one of several resources published by APT Initiatives Ltd to support teachers and students taking AQA AS and A-level Economics. Multiple Choice questions (interactive and printable tests) have been produced for AS Paper 1 and AS Paper 2, as well as for the entire AQA A-level specification, and Practice (Mock) Exam Papers have also been produced for Paper 1 (on Section 4.1 of the A-level Specification) and Paper 3 (on the entire A-level Specification).
A Practice (Mock) Exam Paper for AQA A-level Economics Paper 2 on the National & International Economy, including mark schemes with detailed example answers, written by a senior examiner for multiple examination boards and experienced teacher of AS & A-level Economics. To assess the quality of our papers for AQA A-level Economics a full Paper (for Paper 1 on Markets & Market Failure) is available to download FREE from here: https://www.tes.com/teaching-resource/resource-12154686
This particular paper is the third of 4 Practice (Mock) Exam Papers APT Initiatives Ltd has published for AQA A-level Economics Paper 2 on the National & International Economy. The full set of 4 question papers have been written to include questions that test as many areas listed in the specification subject content relating to Section 4.2 as possible.
Question papers, mark schemes and answers have been written taking into account the specimen assessment material (SAM) for A-level Paper 2 published by AQA for the launch of the new A-level Economics specification (from 2015). The structure, style and format of question papers and mark schemes are in line with this SAM, with a few minor differences / additions considered beneficial for teachers and their students.
For questions carrying high marks, the detailed example answers provided:
are written in paragraph form.
contain a range of comments that attract a mark.
include annotations that show where individual assessment objectives (ie Knowledge, Application, Analysis and Evaluation) have been demonstrated.
These Practice (Mock) Exam Papers are one of several resources published by APT Initiatives Ltd to support teachers and students taking AQA AS and A-level Economics. Multiple Choice questions (interactive and printable tests) have been produced for AS Paper 1 and AS Paper 2, as well as for the entire AQA A-level specification, and Practice (Mock) Exam Papers have also been produced for Paper 1 (on Section 4.1 of the A-level Specification) and Paper 3 (on the entire A-level Specification).
A Practice (Mock) Exam Paper for AQA A-level Economics Paper 2 on the National & International Economy, including mark schemes with detailed example answers, written by a senior examiner for multiple examination boards and experienced teacher of AS & A-level Economics. To assess the quality of our papers for AQA A-level Economics a full Paper (for Paper 1 on Markets & Market Failure) is available to download FREE from here: https://www.tes.com/teaching-resource/resource-12154686
This particular paper is the final of 4 Practice (Mock) Exam Papers APT Initiatives Ltd has published for AQA A-level Economics Paper 2 on the National & International Economy. The full set of 4 question papers have been written to include questions that test as many areas listed in the specification subject content relating to Section 4.2 as possible.
Question papers, mark schemes and answers have been written taking into account the specimen assessment material (SAM) for A-level Paper 2 published by AQA for the launch of the new A-level Economics specification (from 2015). The structure, style and format of question papers and mark schemes are in line with this SAM, with a few minor differences / additions considered beneficial for teachers and their students.
For questions carrying high marks, the detailed example answers provided:
are written in paragraph form.
contain a range of comments that attract a mark.
include annotations that show where individual assessment objectives (ie Knowledge, Application, Analysis and Evaluation) have been demonstrated.
These Practice (Mock) Exam Papers are one of several resources published by APT Initiatives Ltd to support teachers and students taking AQA AS and A-level Economics. Multiple Choice questions (interactive and printable tests) have been produced for AS Paper 1 and AS Paper 2, as well as for the entire AQA A-level specification, and Practice (Mock) Exam Papers have also been produced for Paper 1 (on Section 4.1 of the A-level Specification) and Paper 3 (on the entire A-level Specification).
A Practice (Mock) Exam Paper for AQA A-level Economics Paper 3 on Economic Principles and Issues, including mark schemes with detailed example model answers, written by a senior examiner for multiple examination boards and experienced teacher of AS & A-level Economics. To assess the quality of our papers for AQA A-level Economics a full Paper (for Paper 1 on Markets & Market Failure) is available to download FREE from here: https://www.tes.com/teaching-resource/resource-12154686
This particular paper is the second of 4 Practice (Mock) Exam Papers APT Initiatives Ltd has published for AQA A-level Economics Paper 3 on Economic Principles and Issues. The full set of 4 question papers have been written to include questions that test as many areas listed in the specification subject content as possible.
Question papers, mark schemes and answers have been written taking into account the specimen assessment material (SAM) for A-level Paper 3 published by AQA for the launch of the new A-level Economics specification (from 2015). The structure, style and format of question papers and mark schemes are in line with this SAM, with a few minor differences / additions considered beneficial for teachers and their students.
For questions carrying high marks, the detailed example answers provided:
are written in paragraph form.
contain a range of comments that attract a mark.
include annotations that show where individual assessment objectives (ie Knowledge, Application, Analysis and Evaluation) have been demonstrated.
These Practice (Mock) Exam Papers are one of several resources published by APT Initiatives Ltd to support teachers and students taking AQA AS and A-level Economics. Multiple Choice questions (interactive and printable tests) have been produced for AS Paper 1 and AS Paper 2, as well as for the entire AQA A-level specification, and Practice (Mock) Exam Papers have also been produced for Paper 1 (on Section 4.1 of the A-level Specification) and Paper 2 (on Section 4.2).
A Practice (Mock) Exam Paper for AQA A-level Economics Paper 3 on Economic Principles and Issues, including mark schemes with detailed example model answers, written by a senior examiner for multiple examination boards and experienced teacher of AS & A-level Economics. To assess the quality of our papers for AQA A-level Economics a full Paper (for Paper 1 on Markets & Market Failure) is available to download FREE from here: https://www.tes.com/teaching-resource/resource-12154686
This particular paper is the first of 4 Practice (Mock) Exam Papers APT Initiatives Ltd has published for AQA A-level Economics Paper 3 on Economic Principles and Issues. The full set of 4 question papers have been written to include questions that test as many areas listed in the specification subject content as possible.
Question papers, mark schemes and answers have been written taking into account the specimen assessment material (SAM) for A-level Paper 3 published by AQA for the launch of the new A-level Economics specification (from 2015). The structure, style and format of question papers and mark schemes are in line with this SAM, with a few minor differences / additions considered beneficial for teachers and their students.
For questions carrying high marks, the detailed example answers provided:
are written in paragraph form.
contain a range of comments that attract a mark.
include annotations that show where individual assessment objectives (ie Knowledge, Application, Analysis and Evaluation) have been demonstrated.
These Practice (Mock) Exam Papers are one of several resources published by APT Initiatives Ltd to support teachers and students taking AQA AS and A-level Economics. Multiple Choice questions (interactive and printable tests) have been produced for AS Paper 1 and AS Paper 2, as well as for the entire AQA A-level specification, and Practice (Mock) Exam Papers have also been produced for Paper 1 (on Section 4.1 of the A-level Specification) and Paper 2 (on Section 4.2).
A Practice (Mock) Exam Paper for AQA A-level Economics Paper 3 on Economic Principles and Issues, including mark schemes with detailed example model answers, written by a senior examiner for multiple examination boards and experienced teacher of AS & A-level Economics. To assess the quality of our papers for AQA A-level Economics a full Paper (for Paper 1 on Markets & Market Failure) is available to download FREE from here: https://www.tes.com/teaching-resource/resource-12154686
This particular paper is the final of 4 Practice (Mock) Exam Papers APT Initiatives Ltd has published for AQA A-level Economics Paper 3 on Economic Principles and Issues. The full set of 4 question papers have been written to include questions that test as many areas listed in the specification subject content as possible.
Question papers, mark schemes and answers have been written taking into account the specimen assessment material (SAM) for A-level Paper 3 published by AQA for the launch of the new A-level Economics specification (from 2015). The structure, style and format of question papers and mark schemes are in line with this SAM, with a few minor differences / additions considered beneficial for teachers and their students.
For questions carrying high marks, the detailed example answers provided:
are written in paragraph form.
contain a range of comments that attract a mark.
include annotations that show where individual assessment objectives (ie Knowledge, Application, Analysis and Evaluation) have been demonstrated.
These Practice (Mock) Exam Papers are one of several resources published by APT Initiatives Ltd to support teachers and students taking AQA AS and A-level Economics. Multiple Choice questions (interactive and printable tests) have been produced for AS Paper 1 and AS Paper 2, as well as for the entire AQA A-level specification, and Practice (Mock) Exam Papers have also been produced for Paper 1 (on Section 4.1 of the A-level Specification) and Paper 2 (on Section 4.2).
Practice (Mock) Paper for Edexcel A Level Business PAPER 3 based on June 2019 Context (The Market for Holidays in the UK and Abroad)
This resource is one of 5 resources produced for the 2019 Edexcel A Level Business Paper 3 Context Exam. It consists of a practice paper and detailed mark scheme / answers, which tests various aspects of the Edexcel A Level specification (see below) in relation to the context concerning the Market for Holidays in the UK and Abroad.
It includes stimulus material, questions and detailed answers on the following specification topics:
Theme 1: The market (niche markets), Market research (market orientation), Pricing strategies, Business objectives, Business choices.
Theme 2: External finance (loans, share capital), Profit, Liquidity, Capacity utilisation, Economic influences (exchange rates – depreciation of the pound), The competitive environment.
Theme 3: Impact of external influences, Corporate culture (difficulties in changing), Shareholders versus stakeholders, Interpretation of financial statements (comprehensive income and financial position), Ratio analysis, Key factors in change (organisational culture, managing resistance to change.
Theme 4: Growing economies (emerging economies), Reasons for joint ventures, Marketing (adaptation of the marketing mix), Cultural / social factors.
Product Information
The practice paper and mark scheme (level descriptors) are written in the same style and format as the first Edexcel A Level Business Paper 3 exam (sat in June 2017) and the sample assessment material (SAM) produced by Edexcel for this particular exam.
The question paper includes space for students to write down their answers.
Answers are provided in paragraph form, rather than a list of relevant points anticipated to be raised in the answer.
Answers typically contain a range of examples of comments which can earn high marks in relation to the question set.
The author, Claire Baker, is an experienced teacher, examiner, author and the owner and Managing Director of APT. She has taught Business from ages 11 to 19 and has been an Examiner, Principal Examiner and Reviser for Business and Business related courses for a leading awarding body.
The purchase of this resource comes with a licence to make the resource available in digital and / or in print form (including photocopying) to staff and up to 60 students attending the purchasing institution (ie the individual school / college on a single site) in any given year.
Lesson PowerPoint Presentation on Quality Assurance (10 slides) written by a highly experienced teacher (of 25+ years), senior examiner and reviser for Maths and Stats examinations. It explains quality assurance, the graphs used to monitor quality assurance and how to interpret these with respect to warning and action limits. It includes:
Lesson objectives
Step-by-step explanations of the subject matter
Examples to aid understanding
Questions to check understanding
Answers to questions, with explanations
Suggestions regarding which topic(s) should be moved on to next.
It is 1 of a set of 14 Lesson PowerPoint Presentations on ‘Analysing Data’ that APT Initiatives has published for GCSE Statistics. The full set of set of 14 PowerPoints (238 slides excluding Title Pages) covers the following topics relating to ‘Analysing Data’:
01 Averages – Mode (19 slides).
02 Averages – Median (19 slides).
03 Averages – Mean (19 slides).
04 Other Means – Weighted & Geometric(12 slides).
05 Measures of Dispersion – Range (16 slides).
06 Measures of Dispersion – Interquartile Range (20 slides).
07 Cumulative Frequency (25 slides).
08 Box (and Whisker) Plots (11 slides).
09 Distributions, Variance & Standard Deviation (18 slides).
10 Skewness Coefficients (11 slides).
11 Time Series and Moving Averages (25 slides).
12 Crude and Standardised Rates (11 slides).
13 Index Numbers (22 slides).
14 Quality Assurance (10 slides).
These PowerPoints are one of 4 sets of PowerPoint Presentations that APT Initiatives Ltd has published to support teachers and students of GCSE Statistics. Other sets concern:
Collecting Data
Representing Data
Probability
The purchase of this resource comes with a licence to make the resource available in digital and / or in print form (including photocopying) to the staff and students attending the purchasing institution, ie the individual school / college on a single site. The resource may be distributed via a secure virtual learning environment. It must not be made available on any public or insecure website or other platform. The resource must not be distributed to other institutions that are members of the same academy chain or similar organisation; each individual institution must purchase their own copy of the resource.
PowerPoint Presentation on Sampling and Bias - Application (20 slides): Reviews and applies different sampling techniques and explains the Petersen capture-recapture method. It has been written by a highly experienced teacher (of 25+ years), senior examiner and reviser for Maths and Stats examinations. It includes:
Lesson objectives
Step-by-step explanations of the subject matter
Examples to aid understanding
Questions to check understanding
Answers to questions, with explanations
Suggestions regarding which topic(s) should be moved on to next.
It is 1 of a set of 5 PowerPoint Presentations on ‘Collecting Data’ that APT Initiatives has published for GCSE Statistics. The full set of set of 5 PowerPoints (110 slides excluding Title Pages) covers the following topics relating to ‘Collecting Data’:
01 Types of Data (24 slides): Explains the different types of data and how data can be classified according to who collected it.
02 Methods of Collecting Data (31 slides): Reviews the data handling cycle and explains the main methods of collecting data and how to avoid bias, as well as how to record and clean data.
03 Questionnaires and Surveys (30 slides): Explains the dos and don’ts when designing questionnaires or surveys, reviews grouping data, explains random response techniques and what to do with unexpected responses.
04 Sampling and Bias 1 (25 slides): Defines key statistical terms, outlines how to avoid bias, and explains the main methods of sampling.
05 Sampling and Bias 2 (Application) (20 slides): Reviews and applies different sampling techniques and explains the Petersen capture-recapture method.
This set of 5 PowerPoints are one of 4 sets of PowerPoints that APT Initiatives Ltd has published to support teachers and students of GCSE Statistics. Other sets concern:
Representing Data
Analysing Data
Probability
The purchase of this resource comes with a licence to make the resource available in digital and / or in print form (including photocopying) to the staff and students attending the purchasing institution, ie the individual school / college on a single site. The resource may be distributed via a secure virtual learning environment. It must not be made available on any public or insecure website or other platform. The resource must not be distributed to other institutions that are members of the same academy chain or similar organisation; each individual institution must purchase their own copy of the resource.
PowerPoint Presentation on 3D Symmetry (9 slides): Explains how to find planes of symmetry for 3D Shapes. It has been written by a highly experienced teacher (of 25+ years), senior examiner and reviser for Maths and Stats examinations. It includes:
Lesson objectives
Step-by-step explanations of the subject matter
Examples to aid understanding
Questions to check understanding
Answers to questions, with explanations
Suggestions regarding which topic(s) should be moved on to next.
It is 1 of a set of 10 PowerPoints on 'Symmetry, Transformations and Vectors’ that APT Inititiatives has published for GCSE Maths. The complete set of 10 (149 slides, excluding Title Pages) covers the following topics on ‘Symmetry, Transformations & Vectors’:
01 Line Symmetry (17 slides).
02 Rotational Symmetry (15 slides).
03 3D Symmetry (9 slides).
04 Transformations – Reflections (13 slides).
05 Transformations – Rotations (16 slides).
06 Transformations – Translations (13 slides).
07 Transformations – Enlargements (18 slides).
08 Similarity (17 slides).
09 Proofs of Congruency & Similarity (12 slides).
10 Vectors (19 slides).
These PowerPoints are one of several sets that relate to the ‘Geometry and Measures’ section of the Maths specifications. These other sets concern:
Measures, Perimeter, Area & Volume
Shapes, Angles & Constructions.
The purchase of this resource comes with a licence to make the resource available in digital and / or in print form (including photocopying) to the staff and students attending the purchasing institution, ie the individual school / college on a single site. The resource may be distributed via a secure virtual learning environment. It must not be made available on any public or insecure website or other platform. The resource must not be distributed to other institutions that are members of the same academy chain or similar organisation; each individual institution must purchase their own copy of the resource.