Diagrams that can be used in the assistant in the delivery of lessons based on the feature of coastal features.
Feature:
V-shaped Valley
Waterfall
Meander and ox-bow lake
This lesson is designed to meet the requirements of the Scottish curriculum and provides students with a practical and in-depth understanding of this powerful data visualisation tool.
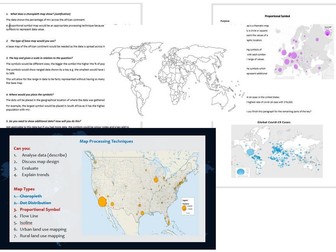
In this lesson, students will delve into the purpose, analysis, design, and evaluation of proportional symbol maps. Through the themes of Covid-19, population density and rivers, students will explore real-world data and develop essential skills that go beyond theoretical knowledge.
This download includes a PowerPoint for teaching and a PDF for pupils. This provides both the notes and tasks for learning purposes.
Key features of the lesson include:
Purpose: Students will understand the fundamental purpose of proportional symbol maps. They will learn how these maps represent the spatial distribution of data points, emphasizing density, concentration, or dispersion. Students will grasp the significance of proportional symbol maps in revealing patterns and relationships.
Analysis: Practical examples will guide students in analysing proportional symbolmaps effectively. They will learn how to interpret the patterns and clusters of symbols, identify trends, and draw meaningful conclusions about the spatial distribution of themes such as Covid-19. This skill will enable them to extract valuable insights from dot distribution maps.
Design: Students will explore the various design considerations for creating impactful proportional symbol maps. They will understand how to select appropriate symbol placement, determine their color if necessary, and consider the use of scales. Students will critically evaluate design choices to enhance the clarity and communicative power of their maps.
Evaluation: The lesson fosters critical thinking skills by teaching students to evaluate dot distribution maps rigorously. They will assess the accuracy and reliability of the data sources, consider potential biases or limitations, and evaluate the map’s effectiveness in communicating information. Students will develop a discerning eye for evaluating and improving dot distribution maps.
Practical Examples and Tasks: Students will work with real data sets, analysing and mapping populations and river changes. Engaging tasks will challenge them to create their own proportional symbol maps, interpret spatial patterns, and present their findings to their peers.
By the end of the lesson, students will have developed valuable skills in data visualisation, analysis, and interpretation that can be applied across various geographical contexts.
Learn how to create powerful proportional symbol maps using ArcGIS and explore population data with this comprehensive resource. Includes a step-by-step guide and an Excel workbook with real-world data.
This lesson can be used in conjustion with the full lesson to create a deeper understanding of the map and develop skills.
In this lesson, students will delve into the purpose, analysis, design, and evaluation of choropleth maps. By using the captivating theme of Italian population density, they will explore real-world data and develop essential skills that go beyond theoretical knowledge.
This download includes a PowerPoint for teaching and a PDF for pupils. This provides both the notes and tasks for learning purposes.
Highlights of the lesson include:
Purpose: Students will learn the fundamental purpose of choropleth maps, understanding how they effectively represent data by utilising varying shades. This will enable them to grasp the significance of choropleth maps in visualising geographic variations.
Analysis: Through practical examples, students will master the art of analysing choropleth maps. They will decode legends, identify patterns, and make insightful comparisons between different regions. This skill will empower them to extract valuable information from choropleth maps.
Design: Students will dive into the intricacies of map design, examining color choices, classification methods, and map projections. By critically evaluating these design elements, they will understand how choices impact data interpretation and presentation.
Evaluation: This lesson fosters critical thinking skills by teaching students to evaluate choropleth maps effectively. They will assess the reliability and objectivity of data sources and the map’s overall effectiveness in conveying information. Students will also explore alternative representations and propose improvements to enhance map clarity and impact.
Practical examples and tasks: The lesson revolves around the captivating theme of Italian population density. Students will work with real data sets and statistics, engaging in hands-on tasks such as data analysis, creating their own choropleth maps, and presenting their findings to their peers. This application-oriented approach enhances their analytical and presentation skills.
By the end of the lesson, students will have have a deeper understanding of choropleth maps and will have gained an understanding of Italian population density. They will possess valuable skills that can be applied across various geographical contexts.
This lesson is designed to meet the requirements of the Scottish curriculum and provides students with a practical and in-depth understanding of this powerful data visualisation tool.
In this lesson, students will delve into the purpose, analysis, design, and evaluation of dot distribution maps. Through the themes of Australian Indigenous groups and Scottish crime, students will explore real-world data and develop essential skills that go beyond theoretical knowledge. The lesson also introduces students to SIMD, what it is and how to use the resources provided by the Scottish Government.
This download includes a PowerPoint for teaching and a PDF for pupils. This provides both the notes and tasks for learning purposes.
Key features of the lesson include:
Purpose: Students will understand the fundamental purpose of dot distribution maps. They will learn how these maps represent the spatial distribution of data points, emphasizing density, concentration, or dispersion. Students will grasp the significance of dot distribution maps in revealing patterns and relationships.
Analysis: Practical examples will guide students in analysing dot distribution maps effectively. They will learn how to interpret the patterns and clusters of dots, identify trends, and draw meaningful conclusions about the spatial distribution of Australia’s Indigenous groups and Scottish crime. This skill will enable them to extract valuable insights from dot distribution maps.
Design: Students will explore the various design considerations for creating impactful dot distribution maps. They will understand how to select appropriate dot placement, determine their color if necessary, and consider the use of legends or scales. Students will critically evaluate design choices to enhance the clarity and communicative power of their maps.
Evaluation: The lesson fosters critical thinking skills by teaching students to evaluate dot distribution maps rigorously. They will assess the accuracy and reliability of the data sources, consider potential biases or limitations, and evaluate the map’s effectiveness in communicating information. Students will develop a discerning eye for evaluating and improving dot distribution maps.
Practical Examples and Tasks: The lesson revolves around the captivating themes of Scottish crime and SIMD. Students will work with real data sets, analyzing and mapping crime incidents or deprivation levels across Scottish regions. Engaging tasks will challenge them to create their own dot distribution maps, interpret spatial patterns, and present their findings to their peers.
By the end of the lesson, students will have a deeper understanding of spatial patterns related to Scottish crime and deprivation. They will possess valuable skills in data visualisation, analysis, and interpretation that can be applied across various geographical contexts.
Learn how to create powerful flow line maps using ArcGIS and explore population data with this comprehensive resource. Includes a step-by-step guide and an Excel workbook with real-world data.
 Quick View
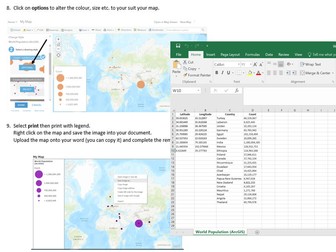 Quick View
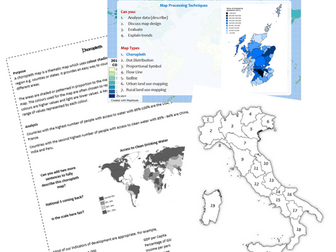 Quick View
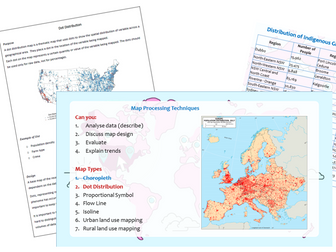 Quick View
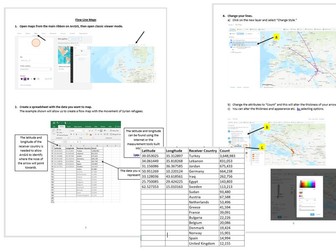 Quick View