 Quick View
AQA Psychology Research Methods: Descriptive statistics, distributions, data display
PowerPoint presentation broken up into 3 35-minute lessons on the following topics:
4.2.3.2. Data handling and analysis
Descriptive statistics: measures of central tendency; calculation of mean, median, and mode; measures of dispersion; range and standard deviation; calculation of range, calculation of percentages
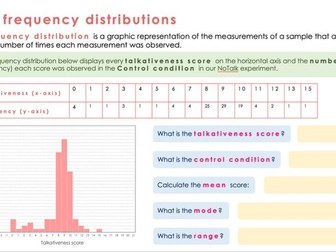
Presentation and display of quantitative data: graphs, tables, bar charts, histograms
Distributions: normal and skewed distributions; characteristics of normal and skewed distributions
The presentation includes question marks as aids embedded active learning activities, as well as starters, plenaries and post-lesson exercises. This may be easily re-arranged by the teacher to accommodate for different lesson times and previous content covered.
The presentation may be uploaded onto a class OneNote so as to allow students to complete the embedded active learning throughout the lessons.