Pupil Experience Tracking/Analysis ToolQuick View
addrand

Pupil Experience Tracking/Analysis Tool

(0)
A free, GDPR-compliant HTML tool for tracking pupil enrichment experiences. Import a CSV, instantly see participation rates, equity gaps, and Ofsted-ready analytics — no login, no server, no data stored. Tracking pupil engagement in wider opportunities, enrichment and other experiences can be extremely difficult and it can be even more difficult to find useful and meaningful information about pupil groups. This tool allow you to complete a very basic spreadsheet which then does all of the analysis and tracking for you. It tells you information at pupil, class, and a whole-school level and breaks down attendance by pupil groups, giving you insight into engagement of vulnerable pupil groups. This tool works entirely in the browser, covers PP, SEND, EAL and gender breakdowns across six tabs — individual pupil profiles, experience analytics with representation vs school average, whole-school overview, equity gap analysis, participation trends heatmap, and a watchlist flagging pupils with zero experiences and activities where disadvantaged groups are under-represented. No setup, no IT department needed — just a CSV and a browser. To help you get started, two Excel spreadsheets (.xlsx) have been provided: a blank template for you to enter your own pupil data, and an example file pre-populated with fictional data so you can explore the app straight away. Before either file can be used by the app, it must first be saved in CSV format. To do this, open the spreadsheet in Excel, go to File > Save As, and choose CSV (Comma delimited) (*.csv) from the file type dropdown. Make sure to save the CSV to a location you can easily find, as you will need to select it when loading data into the app. Note that Excel may warn you that some features will be lost when saving as CSV — this is expected and you can safely click Yes to continue.
Dojo Analysis Tool - Group/ClassQuick View
addrand

Dojo Analysis Tool - Group/Class

(0)
Dojo Behaviour Analyser — Whole Class Tracker Upload a single ClassDojo class report CSV and instantly get a comprehensive visual breakdown of your whole group’s behaviour record — from class-wide totals and positive rates to individual pupil rankings, behaviour-by-behaviour breakdowns, and a clear view of which pupils need support and which deserve recognition. The tool runs entirely in your browser — nothing is uploaded, nothing is stored, and no login is required. A full illustrated user guide is included, covering every feature with annotated screenshots, export instructions, and a FAQ, so any colleague can pick it up and use it confidently without any training. CLASS OVERVIEW TAB Four headline stats show total green dojos, total red dojos, the class average positive rate, and the number of pupils with a completely clean record. A stacked bar chart displays every pupil side by side — green left, red right — so the spread across the class is visible at a glance. Top 5 green earners and top 5 red dojo holders are ranked side by side, and a colour-coded positive percentage heatmap shows every pupil’s rate in one view, making lower performers stand out immediately. INDIVIDUAL PUPIL TAB Select any pupil from a dropdown to load their full profile instantly. A summary card shows their green total, red total, and positive rate, alongside class rank chips showing where they sit relative to their peers. A behaviour breakdown table compares each skill against the class average with Above Average and Below Average badges, and a radar chart overlays the pupil’s profile against the class average so strengths and gaps are visible at a glance. Auto-generated insights summarise the key comparisons in plain language. I have another resource available that goes into much more detail for an individual pupil if this is something you are interested in POSITIVE BEHAVIOURS TAB A ranked bar chart shows every green behaviour category by total points across the class, alongside a donut chart showing each behaviour’s share of the overall green total. A full pupil leaderboard displays every child as a stacked bar broken down by behaviour, with their score compared against the class average — useful for identifying which pupils are strong across multiple categories and which are relying heavily on one. NEEDS WORK TAB The same structure applied to red dojos. A ranked bar chart shows which negative behaviours are most prevalent across the class, a donut shows the proportional split, and a full pupil breakdown ranks every child by their red total with stacked bars showing which specific behaviours are driving their count. A versus-average delta badge shows how far above or below the class average each pupil sits. Pupils with zero red dojos are called out separately at the bottom — a detail worth celebrating with the class.
Dojo Analysis Tool - Individual PupilQuick View
addrand

Dojo Analysis Tool - Individual Pupil

(0)
Easily turn your Class Dojo data into easy to read analysis with clear visualisations to help you spot trends and patterns, identify changes and get a clearer picture of an individual pupil’s behaviour. Pupil Dojo Analyser — Individual Behaviour Tracker Upload a single ClassDojo CSV export (easily done & instructions included) and instantly get a comprehensive, visual breakdown of one pupil’s full behaviour record — everything from their strongest skills to their most frequent red dojo triggers, how their behaviour has changed across the year, and crucially, which dojos were genuinely awarded to them personally versus those they received simply because the whole class did. The tool runs entirely in your browser — nothing is uploaded, nothing is stored, and no login is required. A full illustrated user guide is included, covering every feature with annotated screenshots, export instructions, and a FAQ, so any colleague can pick it up and use it confidently without any training. You will need to download a pupil’s Dojo data from the website to use this tool. Full instructions on how to do this are included in the user guidance. OVERVIEW TAB Headline stats for positive rate, green and red totals, and individual award count sit alongside a weekly activity chart, a Mon-Fri heatmap of every school day colour-coded by dominant behaviour, and a term-by-term breakdown tracking whether behaviour is improving across the year. An auto-generated insights panel surfaces key strengths and flags concerns automatically. TIMELINE TAB Every dojo in reverse chronological order, grouped by date, with the exact time, behaviour, point value, award type, and issuing teacher shown for each entry. Filter by green/red, award type, or specific behaviour — most powerfully, filtering to Red + Individual isolates every incident where a teacher specifically targeted this pupil, as opposed to a whole-class sanction. BEHAVIOURS TAB Ranked bar charts for every green and red behaviour category, with a detailed table breaking each one down by Individual, Group, and Whole Class award count. The Indiv column is the key figure — it shows which behaviours attracted deliberate personal recognition or sanction, rather than collective rewards. Auto-generated insights flag the standout positive behaviour and the most frequently individually-targeted red. TRENDS TAB Four views of behaviour over time: a cumulative green/red line chart, a monthly bar chart for spotting term-level patterns, a rolling 4-week positive percentage line with an 80% benchmark, and a Best Weeks table ranking the pupil’s strongest periods — a useful resource for parent meetings where starting with strengths sets a constructive tone. AWARD TYPES TAB Breaks down every dojo by whether it was Individual, Group, or Whole Class — the tab that transforms a raw total into something meaningful.
Short division practise toolQuick View
addrand

Short division practise tool

(0)
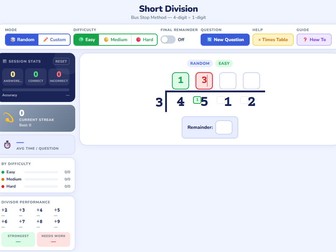
Short Division Practice — Bus Stop Method A tool designed to help primary school pupils master short division using the bus stop method — no login, no app download, no internet connection needed after the first load. Pupils work through 4-digit ÷ 1-digit questions in an authentic bus stop layout, entering each quotient digit above the bracket and carrying remainders into the small boxes exactly as they would on paper. Instant colour feedback — green for correct, red to try again — means pupils know immediately whether they’re on track, without a teacher needing to mark every step. Key features: Three difficulty levels — Easy (÷2–4, simple carries), Medium (÷3–6, moderate carries), Hard (÷6–9, carries close to the divisor) — so the tool works for pupils just beginning the method right through to those preparing for KS2 SATs Final remainder toggle — questions can be set to always produce a remainder, never produce one, or either — ideal for targeting specific learning objectives Times table helper — a tap-to-reveal reference panel showing the full ×1–10 table for whichever divisor is active, supporting pupils who need scaffolding without giving the answer away Step-by-step guide — a child-friendly how-to model with a fully labelled worked example, written accessibly enough for pupils who are brand new to the method Session stats panel — tracks questions answered, accuracy percentage, current streak, average time per question, performance by difficulty, and a per-divisor breakdown showing which times tables need the most practice Intelligent nudges — the tool automatically encourages pupils to move up a difficulty level after 5 consecutive clean answers, and gently suggests stepping down after 3 consecutive struggles Celebration modal — a confetti animation and randomised praise message on every correct completion keeps motivation high, with next-question settings built directly into the pop-up so momentum is never lost Who is it for? Year 5 and 6 teachers looking for a ready-to-use practice tool for lessons, early morning work, or home learning. It works equally well on tablets and desktops, and the stats panel gives teachers a at-a-glance view of where individual pupils are strong and where more teaching is needed — without any data leaving the device. Built as a single HTML file. Open it in any browser and it’s ready to go.